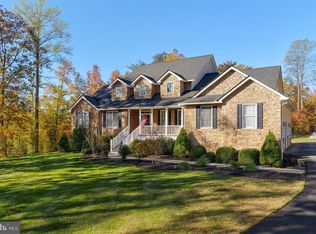
Nestled on nearly 3 picturesque acres, this stunning countryside estate welcomes you with a charming oversized front porch and breathtaking views of open farmland and mature trees, creating a peaceful and private retreat. Inside, refreshing coastal tones and sprawling luxury vinyl plank flooring throughout enhance the home’s bright, open, and airy design. The like-new interior showcases a beautifully renovated gourmet kitchen featuring a massive center island, farmhouse sink, stainless steel appliances, and stylish modern hardware — perfectly blending elegance and functionality. The impressive laundry room offers abundant cabinetry and a large utility sink, making everyday tasks effortless. The inviting family room centers around a cozy gas fireplace, creating the perfect gathering space for family and friends. Upstairs, generously sized bedrooms provide comfort and versatility, including a luxurious primary suite complete with a remodeled spa-inspired bath, walk-in closet, and private sitting room that can easily serve as a fifth bedroom, nursery, or home office. The expansive finished basement includes a full bath and an open layout ideal for entertaining, recreation, or even secondary living quarters. Car enthusiasts and hobbyists will appreciate not only the attached 3-car garage, but also the exceptional detached 2-car garage equipped with a car lift, electricity, and climate control system. Outdoors, enjoy the incredible oversized deck overlooking endless lush greenery, while the fenced area offers a safe haven for pets or play. This remarkable property truly has it all — space, luxury, functionality, and serene countryside beauty — ready for the most discerning buyer seeking their forever home.
Under contract
$830,000
6087 Balls Mill Rd, Midland, VA 22728
5beds
4,268sqft
Est.: Get pre-qualified
Single Family Residence
Built in 2003
2.69 Acres Lot
$835,000 Zestimate®
$194/sqft
$-- HOA
What's special
Private sitting roomCozy gas fireplaceFarmhouse sinkStylish modern hardwareRemodeled spa-inspired bathInviting family roomExpansive finished basement
- 13 days |
- 338 |
- 24 |
Likely to sell faster than
Zillow last checked:
Listing updated:
Listed by:
Tiffany Aquino 703-868-1472,
Redfin Corporation
Source: Bright MLS,MLS#: VAFQ2022094
Facts & features
Interior
Bedrooms & bathrooms
- Bedrooms: 5
- Bathrooms: 4
- Full bathrooms: 3
- 1/2 bathrooms: 1
- Main level bathrooms: 1
Rooms
- Room types: Living Room, Dining Room, Primary Bedroom, Sitting Room, Bedroom 2, Bedroom 3, Bedroom 4, Kitchen, Game Room, Family Room, Foyer, Breakfast Room, Laundry, Bathroom 2, Primary Bathroom
Primary bedroom
- Features: Flooring - HardWood
- Level: Upper
- Area: 266 Square Feet
- Dimensions: 14 X 19
Bedroom 2
- Features: Flooring - Carpet
- Level: Upper
- Area: 440 Square Feet
- Dimensions: 20 X 22
Bedroom 3
- Features: Flooring - Carpet
- Level: Upper
- Area: 182 Square Feet
- Dimensions: 13 X 14
Bedroom 4
- Features: Flooring - Carpet
- Level: Upper
- Area: 154 Square Feet
- Dimensions: 11 X 14
Primary bathroom
- Level: Upper
Bathroom 2
- Level: Upper
Breakfast room
- Features: Flooring - HardWood
- Level: Main
- Area: 150 Square Feet
- Dimensions: 10 X 15
Dining room
- Features: Flooring - HardWood
- Level: Main
- Area: 182 Square Feet
- Dimensions: 13 X 14
Family room
- Features: Fireplace - Gas, Flooring - HardWood
- Level: Main
- Area: 280 Square Feet
- Dimensions: 14 X 20
Foyer
- Level: Main
- Area: 196 Square Feet
- Dimensions: 14 X 14
Game room
- Level: Lower
- Area: 945 Square Feet
- Dimensions: 27 X 35
Kitchen
- Features: Flooring - HardWood, Granite Counters, Double Sink, Pantry
- Level: Main
- Area: 156 Square Feet
- Dimensions: 12 X 13
Laundry
- Level: Main
- Area: 72 Square Feet
- Dimensions: 6 X 12
Living room
- Level: Main
- Area: 196 Square Feet
- Dimensions: 14 X 14
Sitting room
- Features: Flooring - Carpet
- Level: Upper
- Area: 143 Square Feet
- Dimensions: 11 X 13
Heating
- Heat Pump, Propane
Cooling
- Central Air, Electric
Appliances
- Included: Microwave, Dishwasher, Dryer, Refrigerator, Washer, Water Heater, Oven/Range - Electric, Gas Water Heater
- Laundry: Main Level, Laundry Room
Features
- Breakfast Area, Family Room Off Kitchen, Open Floorplan, Formal/Separate Dining Room, Kitchen - Gourmet, Kitchen Island, Pantry, Soaking Tub, Bathroom - Stall Shower, Walk-In Closet(s), Dry Wall
- Flooring: Hardwood, Carpet, Wood
- Basement: Walk-Out Access
- Number of fireplaces: 1
- Fireplace features: Gas/Propane
Interior area
- Total structure area: 4,268
- Total interior livable area: 4,268 sqft
- Finished area above ground: 4,228
- Finished area below ground: 40
Property
Parking
- Total spaces: 6
- Parking features: Garage Faces Side, Garage Door Opener, Inside Entrance, Oversized, Asphalt, Attached, Detached, Driveway
- Attached garage spaces: 6
- Has uncovered spaces: Yes
Accessibility
- Accessibility features: None
Features
- Levels: Three
- Stories: 3
- Patio & porch: Deck, Porch
- Exterior features: Storage
- Pool features: None
- Fencing: Wood
- Has view: Yes
- View description: Garden
- Frontage type: Road Frontage
Lot
- Size: 2.69 Acres
- Features: Cleared, Front Yard, Level, Open Lot, Rear Yard, Rural
Details
- Additional structures: Above Grade, Below Grade, Outbuilding
- Parcel number: 6990588788
- Zoning: RA
- Special conditions: Standard
Construction
Type & style
- Home type: SingleFamily
- Architectural style: Colonial
- Property subtype: Single Family Residence
Materials
- Vinyl Siding
- Foundation: Concrete Perimeter
- Roof: Architectural Shingle
Condition
- New construction: No
- Year built: 2003
- Major remodel year: 2018
Utilities & green energy
- Sewer: On Site Septic
- Water: Private
Community & HOA
Community
- Subdivision: None Available
HOA
- Has HOA: No
Location
- Region: Midland
Financial & listing details
- Price per square foot: $194/sqft
- Tax assessed value: $613,100
- Annual tax amount: $5,929
- Date on market: 5/22/2026
- Listing agreement: Exclusive Right To Sell
- Inclusions: 2 In 1 Washer And Dryer In Basement, Starlink, Tv Mounts Convey Fridge In Kitchen Stove Dishwasher Washer And Dryer In Laundry Room Washer And Dryer In Basement. Curtains In Garage Tv Mounts
- Exclusions: Fridges And Freezers In Garage, Tv's, Basketball Hoop Curtains Inside House, Air Purifiers Throughout House. Do Not Convey,
- Ownership: Fee Simple
Estimated market value
$835,000
$793,000 - $877,000
$4,330/mo
Price history
| Date | Event | Price |
|---|---|---|
| 5/24/2026 | Contingent | $830,000$194/sqft |
Source: | ||
| 5/22/2026 | Listed for sale | $830,000+25.8%$194/sqft |
Source: | ||
| 7/28/2021 | Sold | $660,000-1.3%$155/sqft |
Source: | ||
| 7/4/2021 | Contingent | $669,000$157/sqft |
Source: | ||
| 6/22/2021 | Listed for sale | $669,000+67.3%$157/sqft |
Source: | ||
| 5/3/2016 | Sold | $400,000-9.1%$94/sqft |
Source: Public Record Report a problem | ||
| 4/1/2016 | Pending sale | $440,000$103/sqft |
Source: RE/MAX Regency #FQ9584465 Report a problem | ||
| 3/3/2016 | Listed for sale | $440,000-2.2%$103/sqft |
Source: RE/MAX Regency #FQ9584465 Report a problem | ||
| 12/31/2015 | Listing removed | $450,000$105/sqft |
Source: RE/MAX Regency #FQ9510934 Report a problem | ||
| 10/21/2015 | Price change | $450,000-5.3%$105/sqft |
Source: RE/MAX REGENCY #FQ8648341 Report a problem | ||
| 9/22/2015 | Price change | $475,000-2.1%$111/sqft |
Source: RE/MAX REGENCY #FQ8648341 Report a problem | ||
| 8/1/2015 | Price change | $485,000-3%$114/sqft |
Source: RE/MAX REGENCY #FQ8648341 Report a problem | ||
| 7/13/2015 | Price change | $500,000-4.8%$117/sqft |
Source: RE/MAX REGENCY #FQ8648341 Report a problem | ||
| 6/17/2015 | Listed for sale | $525,000+73.7%$123/sqft |
Source: RE/MAX REGENCY #FQ8648341 Report a problem | ||
| 5/13/2003 | Sold | $302,253$71/sqft |
Source: Public Record Report a problem | ||
Public tax history
| Year | Property taxes | Tax assessment |
|---|---|---|
| 2025 | $5,929 +2.5% | $613,100 |
| 2024 | $5,782 +4.4% | $613,100 |
| 2023 | $5,536 | $613,100 |
| 2022 | $5,536 +14.8% | $613,100 +26.4% |
| 2021 | $4,822 | $485,100 |
| 2020 | -- | $485,100 |
| 2019 | $4,777 | $485,100 |
| 2018 | $4,777 | $485,100 +29% |
| 2016 | -- | $376,000 |
| 2015 | -- | $376,000 |
| 2014 | -- | $376,000 +14.9% |
| 2013 | -- | $327,200 |
| 2012 | -- | $327,200 |
| 2011 | -- | $327,200 |
| 2010 | -- | $327,200 -34.4% |
| 2009 | -- | $498,900 |
| 2008 | -- | $498,900 |
| 2007 | -- | $498,900 |
| 2005 | -- | $498,900 +86.4% |
| 2004 | -- | $267,600 +215.9% |
| 2003 | -- | $84,700 |
Find assessor info on the county website
Monthly payment
Est. payment$--/mo
Payment breakdown
Explore the cost of this home by adjusting the details. Changes won't be saved.
All calculations are estimates and provided by Zillow, Inc. for informational purposes only. Actual amounts may vary.
HOA fees may include property taxes on listings classified as Co-Ops. Contact the listing agent and/or owner for fee details.
Mortgage interest rates are dependent on a number of factors, including credit score, down payment, and repayment length. Interest rate data provided by Zillow Group Marketplace, Inc. as of 1/1/1970 from various mortgage lenders with which we have lead or other similar arrangements; the Estimated Payment is an average of those rates.
See how much you could borrow to make a competitive offer.
Climate risks
Neighborhood: 22728
Nearby schools
GreatSchools rating
- 4/10H.M. Pearson Elementary SchoolGrades: PK-5Distance: 4.7 mi
- 6/10W.C. Taylor Middle SchoolGrades: 6-8Distance: 7.3 mi
- 5/10Liberty High SchoolGrades: 9-12Distance: 2.1 mi
Schools provided by the listing agent
- Elementary: H. M. Pearson
- Middle: Wc Taylor
- High: Liberty
- District: Fauquier County Public Schools
Source: Bright MLS. This data may not be complete. We recommend contacting the local school district to confirm school assignments for this home.
A local agent can set up tours, give advice and negotiate with sellers.


- Virginia
- Fauquier County
- Midland
- 22728
- 6087 Balls Mill Rd
Nearby cities
Nearby zip codes
Other Midland Topics
