Investment opportunity, currently leased tenant in good standing.
For sale
Price cut: $1.1K (6/11)
$119,900
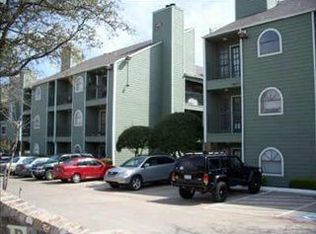
6108 Abrams Rd APT 303, Dallas, TX 75231
1beds
600sqft
Condominium
Built in 1984
-- sqft lot
$114,900 Zestimate®
$200/sqft
$382/mo HOA
What's special
- 72 days |
- 25 |
- 2 |
Zillow last checked:
Listing updated:
Listed by:
Lucas Reader 0766617,
Ray O'Connor III, Broker 817-929-2802
Source: NTREIS,MLS#: 21246208
Loading...
Facts & features
Interior
Bedrooms & bathrooms
- Bedrooms: 1
- Bathrooms: 1
- Full bathrooms: 1
Primary bedroom
- Level: First
- Dimensions: 0 x 0
Living room
- Level: First
- Dimensions: 0 x 0
Features
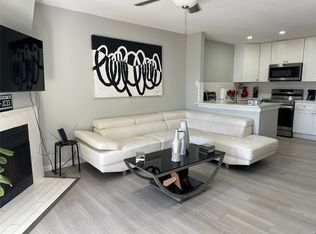
- Decorative/Designer Lighting Fixtures
- Has basement: No
- Number of fireplaces: 1
- Fireplace features: Other
Interior area
- Total interior livable area: 600 sqft
Video & virtual tour
Property
Parking
- Total spaces: 1
- Parking features: Additional Parking
- Carport spaces: 1
Features
- Levels: One
- Stories: 1
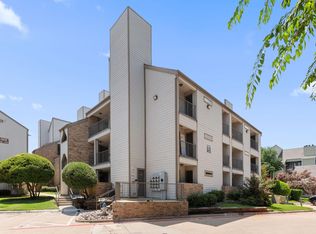
- Pool features: Pool
Lot
- Size: 4.3 Acres
Details
- Parcel number: 00C66800000C00303
Construction
Type & style
- Home type: Condo
- Property subtype: Condominium
- Attached to another structure: Yes
Condition
- Year built: 1984
Utilities & green energy
- Sewer: Public Sewer
- Water: Public
- Utilities for property: Electricity Connected, Other, Sewer Available, Separate Meters, Water Available
Community & HOA
Community
- Subdivision: Sable Rdg Condo
HOA
- Has HOA: Yes
- Services included: Association Management, Maintenance Grounds, Maintenance Structure, Pest Control
- HOA fee: $382 monthly
- HOA name: X
- HOA phone: 123-456-7890
Location
- Region: Dallas
Financial & listing details
- Price per square foot: $200/sqft
- Tax assessed value: $102,840
- Annual tax amount: $2,290
- Date on market: 4/27/2026
- Cumulative days on market: 72 days
Estimated market value
$114,900
$109,000 - $121,000
$1,000/mo
Price history
| Date | Event | Price |
|---|---|---|
| 6/11/2026 | Price change | $119,900-0.9%$200/sqft |
Source: NTREIS #21246208 Report a problem | ||
| 5/19/2026 | Price change | $121,000-3.1%$202/sqft |
Source: NTREIS #21246208 Report a problem | ||
| 4/27/2026 | Listed for sale | $124,900-7.1%$208/sqft |
Source: NTREIS #21246208 Report a problem | ||
| 4/23/2026 | Listing removed | $1,100$2/sqft |
Source: Zillow Rentals Report a problem | ||
| 4/8/2026 | Listed for rent | $1,100$2/sqft |
Source: Zillow Rentals Report a problem | ||
| 3/13/2024 | Listing removed | -- |
Source: Zillow Rentals Report a problem | ||
| 3/8/2024 | Price change | $1,100-8.3%$2/sqft |
Source: Zillow Rentals Report a problem | ||
| 2/15/2024 | Listed for rent | $1,200$2/sqft |
Source: Zillow Rentals Report a problem | ||
| 2/7/2024 | Sold | -- |
Source: NTREIS #20503486 Report a problem | ||
| 1/28/2024 | Contingent | $134,500$224/sqft |
Source: NTREIS #20503486 Report a problem | ||
| 1/3/2024 | Listed for sale | $134,500+34.6%$224/sqft |
Source: NTREIS #20503486 Report a problem | ||
| 8/18/2021 | Sold | -- |
Source: NTREIS #14569958 Report a problem | ||
| 7/15/2021 | Pending sale | $99,900$167/sqft |
Source: NTREIS #14569958 Report a problem | ||
| 6/18/2021 | Price change | $99,900-4.8%$167/sqft |
Source: NTREIS #14569958 Report a problem | ||
| 6/10/2021 | Price change | $104,900-4.5%$175/sqft |
Source: NTREIS #14569958 Report a problem | ||
| 5/27/2021 | Price change | $109,900-4.4%$183/sqft |
Source: NTREIS #14569958 Report a problem | ||
| 5/7/2021 | Listed for sale | $115,000+349.3%$192/sqft |
Source: NTREIS #14569958 Report a problem | ||
| 8/27/2013 | Listing removed | $25,595$43/sqft |
Source: L & L Property Management #12005986 Report a problem | ||
| 8/10/2013 | Listed for sale | $25,595$43/sqft |
Source: L & L Property Management #12005986 Report a problem | ||
Public tax history
| Year | Property taxes | Tax assessment |
|---|---|---|
| 2025 | $2,290 -7.4% | $102,840 -7% |
| 2024 | $2,473 +3.3% | $110,630 +6% |
| 2023 | $2,394 -0.6% | $104,340 +8.7% |
| 2022 | $2,410 +52.3% | $96,000 +60% |
| 2021 | $1,583 -2.8% | $60,000 |
| 2020 | $1,628 -0.8% | $60,000 |
| 2019 | $1,640 +20.1% | $60,000 +25% |
| 2018 | $1,366 +14.7% | $48,000 +9.6% |
| 2017 | $1,191 +47.4% | $43,800 +47.4% |
| 2016 | $808 +29.2% | $29,720 +30.4% |
| 2015 | $625 | $22,800 |
| 2014 | $625 | $22,800 |
| 2013 | -- | -- |
| 2012 | -- | -- |
| 2011 | -- | -- |
| 2010 | -- | -- |
| 2009 | -- | -- |
| 2008 | -- | -- |
| 2007 | -- | -- |
| 2005 | -- | -- |
| 2004 | -- | -- |
| 2003 | -- | -- |
| 2002 | -- | -- |
| 2001 | -- | -- |
Find assessor info on the county website
Monthly payment
Est. payment$--/mo
Payment breakdown
Explore the cost of this home by adjusting the details. Changes won't be saved.All calculations are estimates and provided by Zillow, Inc. for informational purposes only. Actual amounts may vary.
HOA fees may include property taxes on listings classified as Co-Ops. Contact the listing agent and/or owner for fee details.
Mortgage interest rates are dependent on a number of factors, including credit score, down payment, and repayment length. Interest rate data provided by Zillow Group Marketplace, Inc. as of 1/1/1970 from various mortgage lenders with which we have lead or other similar arrangements; the Estimated Payment is an average of those rates.
See how much you could borrow to make a competitive offer.
Climate risks
Neighborhood: Merriman Park-University Manor
Nearby schools
GreatSchools rating
- 5/10L L Hotchkiss Elementary SchoolGrades: PK-8Distance: 0.4 mi
- 5/10Emmett J Conrad High SchoolGrades: 9-12Distance: 1.3 mi
- 4/10Sam Tasby Middle SchoolGrades: 6-8Distance: 1.3 mi
Schools provided by the listing agent
- Elementary: Hotchkiss
- Middle: Tasby
- High: Conrad
- District: Dallas ISD
Source: NTREIS. This data may not be complete. We recommend contacting the local school district to confirm school assignments for this home.

A local agent can set up tours, give advice and negotiate with sellers.


- Texas
- Dallas County
- Dallas
- 75231
- Merriman Park-University Manor
- 6108 Abrams Rd Apartment 303
Nearby cities
Nearby neighborhoods
Nearby zip codes
Other Dallas Topics
