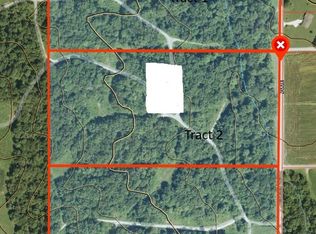
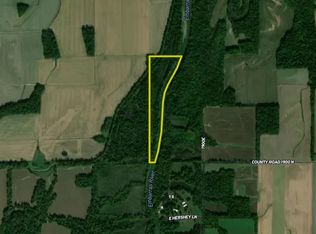
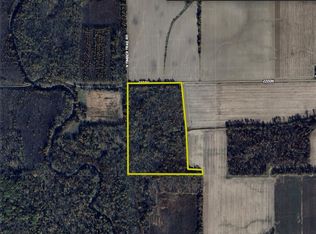
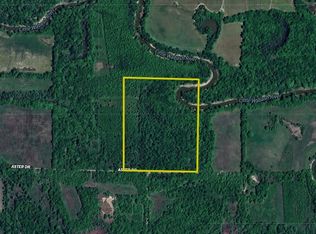
20.3 Acres of Tillable Farmland – Richland County, IL. Located northwest of Route 130 on North Fox Road, this property offers 20.3 acres of productive tillable ground in a great farming area of Richland County, Illinois. This tract is an excellent opportunity for anyone looking to expand their current farming operation or invest in high-quality farmland. If you're looking for additional acres to farm next season, this property is ready to go. With strong soils, good access, and a convenient location, it's an ideal opportunity for both local farmers and investors. For the most accurate information or a showing, contact Land Specialist at .
Lot/land
$144,800
6115 N Fox Rd, Olney, IL 62450
--beds
0baths
20.3Acres
Unimproved Land
Built in ----
20.3 Acres Lot
$-- Zestimate®
$--/sqft
$-- HOA
What's special
- 99 days |
- 230 |
- 2 |
Zillow last checked: 8 hours ago
Listed by:
Travis Boyer,
Mossy Oak Properties Indiana Land and Lifestyle 765-505-4155
Source: REALSTACK,MLS#: 93720
Facts & features
Interior
Property
Lot
- Size: 20.3 Acres
Details
- Parcel number: 0608400002
Community & HOA
Location
- Region: Olney
Financial & listing details
- Tax assessed value: $14,022
- Annual tax amount: $639
- Date on market: 11/14/2025
- Lease term: Contact For Details
Estimated market value
Not available
Estimated sales range
Not available
$1,316/mo
Price history
Price history
| Date | Event | Price |
|---|---|---|
| 11/14/2025 | Listed for sale | $144,800 |
Source: REALSTACK #93720 Report a problem | ||
Public tax history
Public tax history
| Year | Property taxes | Tax assessment |
|---|---|---|
| 2024 | $639 +8.9% | $14,022 +11.1% |
| 2023 | $587 +8.6% | $12,617 +11.3% |
| 2022 | $540 +7.5% | $11,334 +10.3% |
| 2021 | $503 +10.8% | $10,280 +9% |
| 2020 | $454 +10.8% | $9,430 +8% |
| 2019 | $410 +13.4% | $8,734 +7.8% |
| 2018 | $361 +12.2% | $8,100 +8.3% |
| 2017 | $322 +11% | $7,482 +10.6% |
| 2016 | $290 +12.5% | $6,763 +10.4% |
| 2015 | $258 +11.3% | $6,126 +6.3% |
| 2014 | $231 +4.9% | $5,764 +7.4% |
| 2013 | $221 +1.6% | $5,367 +0.7% |
| 2011 | $217 +2.2% | $5,330 |
| 2010 | $213 | $5,330 |
Find assessor info on the county website
BuyAbility℠ payment
Estimated monthly payment
Boost your down payment with 6% savings match
Earn up to a 6% match & get a competitive APY with a *. Zillow has partnered with to help get you home faster.
Learn more*Terms apply. Match provided by Foyer. Account offered by Pacific West Bank, Member FDIC.Climate risks
Neighborhood: 62450
Nearby schools
GreatSchools rating
- 8/10East Richland Elementary SchoolGrades: PK-5Distance: 4.7 mi
- 7/10East Richland Middle SchoolGrades: 6-8Distance: 4.4 mi
- 7/10East Richland High SchoolGrades: 9-12Distance: 4.6 mi
Local experts in 62450