Fully Rented, tenants pay for heat. Close to all transportation.
Active
$450,000
6137 S Rhodes Ave, Chicago, IL 60637
7beds
--sqft
Multi Family
Built in 1908
-- sqft lot
$447,100 Zestimate®
$--/sqft
$-- HOA
What's special
- 7 days
- 140
- 16
Zillow last checked:
Listing updated:
Listed by:
Justin Grant 773-507-2464,
Michael Gabriel Real Estate
Source: MRED as distributed by MLS GRID,MLS#: 12787274
Facts & features
Interior
Bedrooms & bathrooms
- Bedrooms: 7
- Bathrooms: 2
- Full bathrooms: 2
Heating
- Forced Air
Features
- Basement: Unfinished,Full
Property
Lot
- Size: 3,720 Square Feet
- Dimensions: 30X124
Details
- Parcel number: 20154110120000
- Special conditions: None
Construction
Type & style
- Home type: MultiFamily
- Property subtype: Multi Family
Materials
- Brick/Stone Msn Pred
Condition
- New construction: No
- Year built: 1908
Utilities & green energy
- Sewer: Public Sewer
- Water: Lake Michigan
Community & HOA
Location
- Region: Chicago
Financial & listing details
- Tax assessed value: $340,000
- Annual tax amount: $4,447
- Date on market: 10/17/2026
- Ownership: Fee Simple
Estimated market value
$447,100
$425,000 - $469,000
$1,788/mo
Price history
| Date | Event | Price |
|---|---|---|
| 10/17/2026 | Listed for sale | $450,000+52.5% |
Source:  MRED as distributed by MLS GRID #12787274 Report a problem | ||
| 5/12/2005 | Sold | $295,000+90.3% |
Source: Public Record Report a problem | ||
| 10/31/2001 | Sold | $155,000+64% |
Source: Public Record Report a problem | ||
| 8/4/1999 | Sold | $94,500 |
Source: Public Record Report a problem | ||
Public tax history
| Year | Property taxes | Tax assessment |
|---|---|---|
| 2024 | $6,852 +54.1% | $34,000 +61.9% |
| 2023 | $4,447 +2.9% | $21,000 |
| 2022 | $4,319 +2.3% | $21,000 |
| 2021 | $4,223 +5.6% | $21,000 +17% |
| 2020 | $3,998 -2.4% | $17,945 -12% |
| 2019 | $4,097 +1.7% | $20,393 |
| 2018 | $4,028 +5.1% | $20,393 +14.5% |
| 2017 | $3,834 +7.5% | $17,811 |
| 2016 | $3,567 +9.3% | $17,811 |
| 2015 | $3,264 +14.6% | $17,811 +16.1% |
| 2014 | $2,847 +2% | $15,345 |
| 2013 | $2,791 +1.4% | $15,345 |
| 2012 | $2,754 -12.8% | $15,345 -21.3% |
| 2011 | $3,159 -0.4% | $19,494 |
| 2010 | $3,172 +4.4% | $19,494 |
| 2009 | $3,040 -23.4% | $19,494 -29.5% |
| 2008 | $3,969 +1% | $27,668 |
| 2007 | $3,930 -1.1% | $27,668 |
| 2006 | $3,972 +89.2% | $27,668 +115.3% |
| 2005 | $2,100 +66.1% | $12,851 |
| 2004 | $1,264 -37.8% | $12,851 |
| 2003 | $2,034 +26.6% | $12,851 +43.7% |
| 2002 | $1,607 +34.1% | $8,943 |
| 2001 | $1,198 +4.5% | $8,943 |
| 2000 | $1,147 -0.7% | $8,943 +49.8% |
| 1999 | $1,154 | $5,969 |
Find assessor info on the county website
Monthly payment
Est. payment
Payment breakdown
Explore the cost of this home by adjusting the details. Changes won't be saved.Climate risks
Neighborhood: West Woodlawn
Nearby schools


Similar homes
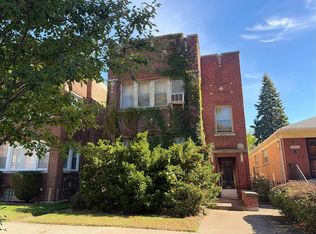
- $--6 bd2 ba2.9k sqft7209 S Michigan Ave, Chicago, IL 60619Auction
 Auction.com 2
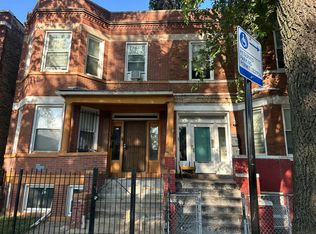
- $594,9006 bd4 ba-- sqft6610 S Evans Ave, Chicago, IL 60637New
 MLS ID #12774665, Marc Whitley, Coldwell Banker Realty. MRED as distributed by MLS GRID
- $--10 bd4 ba-- sqft5303 S Washtenaw Ave, Chicago, IL 60632Auction
 MLS ID #12786665, Ryan Smith, Smith Partners & Associates. MRED as distributed by MLS GRID
- $--4 bd2 ba2.1k sqft5414 S Wood St, Chicago, IL 60609Auction
 Auction.com 2
