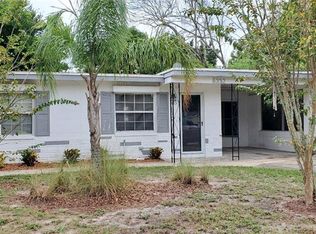
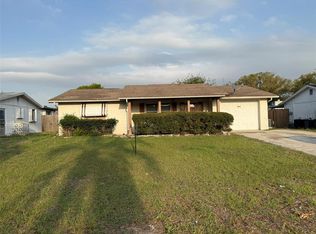
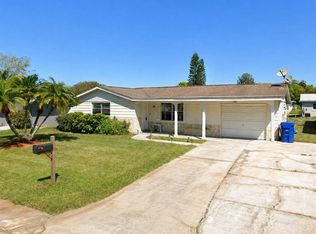
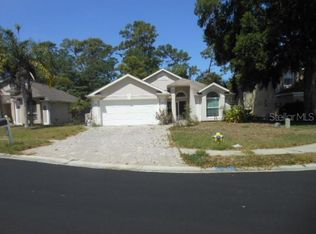
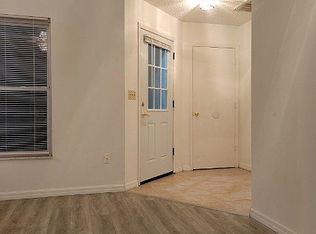
Beautiful 4 bedroom, 2 full bath home in Downtown New Port Richey! Gorgeous laminate flooring has been laid throughout the living areas. Kitchen has been totally remodeled with wood cabinets, granite countertops, tile backsplash and brand new stainless steel appliances. As you move through the house you'll notice that the Seller truly paid every attention to detail in everything! Continuing through the sliding glass door you'll enjoy your huge sun deck, perfect for entertaining or sun bathing. The large backyard has new sod and the two sheds have been painted. This home is just waiting for you. Walking distances to local attractions; The New Port Richey Recreation & Aquatic Center ($14M state-of-the-art facility with another 2.5M in renovations planned), Sims Park with $1 million towards a a new playground, a splash pad, shade structures and kayak launch, Morton Plant North Bay Hospital, New Port Richey Library. Room Sizes are approximate. Buyer to verify all details.
Foreclosed
Est. $208,600
6340 Harrison St, New Port Richey, FL 34653
4beds
1,792sqft
SingleFamily
Built in 1951
7,501 Square Feet Lot
$208,600 Zestimate®
$116/sqft
$-- HOA
Overview
- 18 days |
- 118 |
- 7 |
Facts & features
Interior
Bedrooms & bathrooms
- Bedrooms: 4
- Bathrooms: 2
- Full bathrooms: 2
Heating
- Forced air
Cooling
- Central
Appliances
- Included: Dishwasher, Microwave, Range / Oven, Refrigerator
Features
- Solid Wood Cabinets, Solid Stone Counters
- Flooring: Laminate
Interior area
- Total interior livable area: 1,792 sqft
Property
Features
- Exterior features: Stucco, Wood
Lot
- Size: 7,501 Square Feet
Details
- Parcel number: 0426160030068000070
Construction
Type & style
- Home type: SingleFamily
Materials
- Concrete Block
- Roof: Metal
Condition
- Year built: 1951
Utilities & green energy
- Utilities for property: County Water, Electric, Public Utilities, City Water
Community & HOA
Location
- Region: New Port Richey
Financial & listing details
- Price per square foot: $116/sqft
- Tax assessed value: $226,700
- Annual tax amount: $3,344
- Ownership: Fee Simple
Visit our professional directory to find a foreclosure specialist in your area that can help with your home search.
Find a foreclosure agentForeclosure details
Estimated market value
$208,600
$198,000 - $219,000
$2,364/mo
Price history
| Date | Event | Price |
|---|---|---|
| 5/1/2026 | Sold | $130,100-40.6%$73/sqft |
Source: Public Record Report a problem | ||
| 4/3/2026 | Price change | $219,000+9.5%$122/sqft |
Source: | ||
| 2/17/2026 | Pending sale | $200,000$112/sqft |
Source: | ||
| 2/11/2026 | Listed for sale | $200,000-16.7%$112/sqft |
Source: | ||
| 2/10/2026 | Listing removed | $240,000$134/sqft |
Source: | ||
| 8/1/2025 | Pending sale | $240,000$134/sqft |
Source: | ||
| 8/1/2025 | Listed for sale | $240,000+76.5%$134/sqft |
Source: | ||
| 5/18/2017 | Sold | $136,000-2.8%$76/sqft |
Source: Public Record Report a problem | ||
| 3/24/2017 | Listed for sale | $139,900+87.8%$78/sqft |
Source: REALTY ONE GROUP ADVANTAGE #T2871733 Report a problem | ||
| 11/1/2016 | Sold | $74,500-11.3%$42/sqft |
Source: Public Record Report a problem | ||
| 8/18/2016 | Price change | $84,000-2.8%$47/sqft |
Source: SUNCOAST GROUP REALTORS LLC #U7760459 Report a problem | ||
| 8/11/2016 | Price change | $86,400-0.6%$48/sqft |
Source: SUNCOAST GROUP REALTORS LLC #U7760459 Report a problem | ||
| 7/3/2016 | Price change | $86,900-3.3%$48/sqft |
Source: SUNCOAST GROUP REALTORS LLC #U7760459 Report a problem | ||
| 5/10/2016 | Listed for sale | $89,900$50/sqft |
Source: SUNCOAST GROUP REALTORS LLC #U7760459 Report a problem | ||
| 3/12/2016 | Pending sale | $89,900$50/sqft |
Source: SUNCOAST GROUP REALTORS LLC #U7760459 Report a problem | ||
| 3/5/2016 | Price change | $89,900-7.2%$50/sqft |
Source: SUNCOAST GROUP REALTORS LLC #U7760459 Report a problem | ||
| 2/10/2016 | Listed for sale | $96,900$54/sqft |
Source: SUNCOAST GROUP REALTORS LLC #U7760459 Report a problem | ||
| 1/28/2016 | Pending sale | $96,900$54/sqft |
Source: SUNCOAST GROUP REALTORS LLC #U7760459 Report a problem | ||
| 1/15/2016 | Price change | $96,900-2.1%$54/sqft |
Source: SUNCOAST GROUP REALTORS LLC #U7760459 Report a problem | ||
| 11/7/2015 | Listed for sale | $99,000-88.2%$55/sqft |
Source: Owner Report a problem | ||
| 8/12/2015 | Sold | $837,000+1851%$467/sqft |
Source: Public Record Report a problem | ||
| 6/24/2015 | Pending sale | $42,900$24/sqft |
Source: RE/MAX ELITE REALTY #U7732337 Report a problem | ||
| 5/5/2015 | Price change | $42,900-14%$24/sqft |
Source: RE/MAX ELITE REALTY #U7732337 Report a problem | ||
| 3/20/2015 | Price change | $49,900-16.7%$28/sqft |
Source: Coldwell Banker Residential Real Estate - North Tampa #T2729516 Report a problem | ||
| 1/21/2015 | Listed for sale | $59,900-52.5%$33/sqft |
Source: Coldwell Banker Residential Real Estate - North Tampa #T2729516 Report a problem | ||
| 3/1/2005 | Sold | $126,000$70/sqft |
Source: Public Record Report a problem | ||
Public tax history
| Year | Property taxes | Tax assessment |
|---|---|---|
| 2024 | $3,344 +1.6% | $112,320 |
| 2023 | $3,291 +4.8% | $112,320 +3% |
| 2022 | $3,142 | $109,050 +6.1% |
| 2021 | $3,142 +2.4% | $102,800 +1.4% |
| 2020 | $3,067 +1.5% | $101,390 +2.3% |
| 2019 | $3,020 | $99,116 +1.9% |
| 2018 | $3,020 +1.7% | $97,268 +25.8% |
| 2017 | $2,971 +41.4% | $77,324 +23.3% |
| 2016 | $2,101 +24.5% | $62,735 +3.2% |
| 2015 | $1,687 +3.1% | $60,797 +2.4% |
| 2014 | $1,636 | $59,350 +3.6% |
| 2013 | -- | $57,296 -4.6% |
| 2012 | -- | $60,072 -12.2% |
| 2011 | -- | $68,442 -17.4% |
| 2010 | -- | $82,834 -13.1% |
| 2009 | -- | $95,346 -26.2% |
| 2008 | -- | $129,162 +2% |
| 2007 | -- | $126,622 +2.8% |
| 2006 | -- | $123,223 +21.9% |
| 2005 | -- | $101,101 +27.1% |
| 2004 | -- | $79,523 +5.6% |
| 2003 | -- | $75,271 +24.9% |
| 2002 | -- | $60,268 +17% |
| 2000 | -- | $51,499 |
| 1999 | -- | $51,499 |
Find assessor info on the county website
Monthly payment
Estimated monthly payment
All calculations are estimates and provided by Zillow, Inc. for informational purposes only. Actual amounts may vary.
HOA fees may include property taxes on listings classified as Co-Ops. Contact the listing agent and/or owner for fee details.
Mortgage interest rates are dependent on a number of factors, including credit score, down payment, and repayment length. Interest rate data provided by Zillow Group Marketplace, Inc. as of 1/1/1970 from various mortgage lenders with which we have lead or other similar arrangements; the Estimated Payment is an average of those rates.
See how much you could borrow to make a competitive offer.
Climate risks
Neighborhood: North Park
Nearby schools
GreatSchools rating
- 2/10Richey Elementary SchoolGrades: PK-5Distance: 0.6 mi
- 2/10Gulf Middle SchoolGrades: 6-8Distance: 0.4 mi
- 3/10Gulf High SchoolGrades: 9-12Distance: 1.3 mi


- Florida
- Pasco County
- New Port Richey
- 34653
- North Park
- 6340 Harrison St
Nearby cities
Nearby neighborhoods
Nearby zip codes
Other New Port Richey Topics
