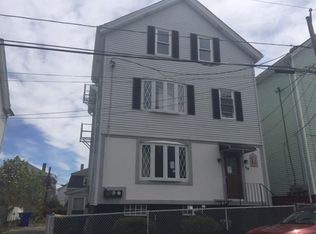
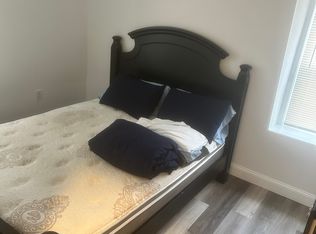
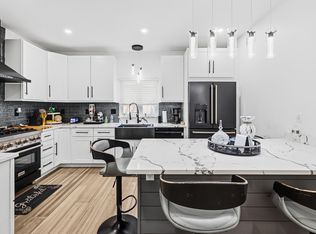
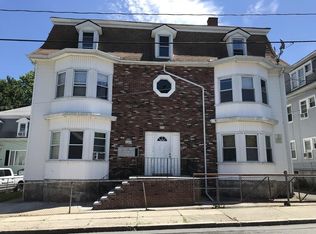
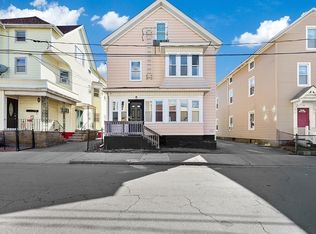
Updated and spacious 2-family home with excellent income potential. Unit 1 offers 2 bedrooms, a bright double parlor, and an eat-in kitchen perfect for everyday living. Unit 2 is a townhouse style unit featuring 4 bedrooms and 2 full bathrooms, currently rented at $2,300/month, providing strong and consistent rental income. The townhouse layout offers separation of space and added privacy, making it highly desirable for tenants. Recent updates enhance both units, offering a move-in ready opportunity for an owner-occupant or investor. Ideal for those looking to offset their mortgage or expand their portfolio. Conveniently located close to shopping, dining, public transportation, and major highways, making commuting easy and efficient. Unit 1 to be delivered vacant at closing.
For sale
$499,900
654 3rd St, Fall River, MA 02721
6beds
2,409sqft
Est.:
2 Family - 2 Units Up/Down
Built in 1900
-- sqft lot
$549,900 Zestimate®
$208/sqft
$-- HOA
What's special
Bright double parlor
- 1 day |
- 330 |
- 12 |
Zillow last checked: 7 hours ago
Listing updated: 12 hours ago
Listed by:
Team ROSO 508-951-4104,
RE/MAX Vantage 774-992-0297,
Ryan Rebello 508-967-4743
Source: MLS PIN,MLS#: 73490110
Tour with a local agent
Facts & features
Interior
Bedrooms & bathrooms
- Bedrooms: 6
- Bathrooms: 3
- Full bathrooms: 3
Features
- Has basement: No
- Has fireplace: No
Interior area
- Total structure area: 2,409
- Total interior livable area: 2,409 sqft
- Finished area above ground: 2,409
Property
Lot
- Size: 2,614 Square Feet
- Features: Other
Details
- Parcel number: FALLM0I12B0000L0024
- Zoning: RES
Construction
Type & style
- Home type: MultiFamily
- Property subtype: 2 Family - 2 Units Up/Down
Materials
- Foundation: Other
Condition
- Year built: 1900
Utilities & green energy
- Sewer: Public Sewer
- Water: Public
Community & HOA
Location
- Region: Fall River
Financial & listing details
- Price per square foot: $208/sqft
- Tax assessed value: $382,600
- Annual tax amount: $4,381
- Date on market: 3/22/2026
- Total actual rent: 2300
Estimated market value
$549,900
$500,000 - $605,000
$1,924/mo
Price history
Price history
| Date | Event | Price |
|---|---|---|
| 3/23/2026 | Listed for sale | $499,900+488.8%$208/sqft |
Source: MLS PIN #73490110 Report a problem | ||
| 6/16/2010 | Listing removed | $84,900$35/sqft |
Source: Stephen T. Lewin #71090203 Report a problem | ||
| 6/5/2010 | Listed for sale | $84,900-34.8%$35/sqft |
Source: Stephen T. Lewin #71090203 Report a problem | ||
| 5/18/2010 | Sold | $130,223-13.1%$54/sqft |
Source: Public Record Report a problem | ||
| 7/8/2009 | Listing removed | $149,900$62/sqft |
Source: Louis G Andrade #70860667 Report a problem | ||
| 6/6/2009 | Price change | $149,900-11.8%$62/sqft |
Source: Louis G Andrade #70860667 Report a problem | ||
| 3/29/2009 | Price change | $169,900-10.5%$71/sqft |
Source: Louis G Andrade #70860667 Report a problem | ||
| 1/7/2009 | Listed for sale | $189,900-9.6%$79/sqft |
Source: Louis G Andrade #70860667 Report a problem | ||
| 11/18/2002 | Sold | $210,000$87/sqft |
Source: Public Record Report a problem | ||
Public tax history
Public tax history
| Year | Property taxes | Tax assessment |
|---|---|---|
| 2025 | $4,381 +10.4% | $382,600 +10.8% |
| 2024 | $3,967 +10.5% | $345,300 +18.1% |
| 2023 | $3,589 +8.1% | $292,500 +11.2% |
| 2022 | $3,319 +11.3% | $263,000 +21.9% |
| 2021 | $2,983 +11.8% | $215,700 +16.8% |
| 2020 | $2,669 +3.9% | $184,700 +4.9% |
| 2019 | $2,568 +5.1% | $176,100 +5.4% |
| 2018 | $2,443 +7.8% | $167,100 +3.2% |
| 2017 | $2,267 -5.5% | $161,900 -8% |
| 2016 | $2,399 +6.2% | $176,000 +2% |
| 2015 | $2,258 -5.4% | $172,600 -9.1% |
| 2014 | $2,388 +3.5% | $189,800 -1.9% |
| 2013 | $2,307 +6.6% | $193,400 -1.9% |
| 2012 | $2,164 +10.4% | $197,100 -9.1% |
| 2010 | $1,960 +2.5% | $216,800 -8.7% |
| 2009 | $1,913 -5.1% | $237,400 -9.7% |
| 2008 | $2,016 +6.3% | $262,900 -0.4% |
| 2007 | $1,896 +24% | $264,000 +18% |
| 2006 | $1,529 +4.7% | $223,800 +16.6% |
| 2005 | $1,460 +2.2% | $191,900 +10.2% |
| 2004 | $1,429 +22.5% | $174,100 +59.7% |
| 2003 | $1,167 +8.8% | $109,000 |
| 2002 | $1,073 +3% | $109,000 +9.4% |
| 2000 | $1,042 +29.4% | $99,600 +13.6% |
| 1995 | $805 | $87,700 |
Find assessor info on the county website
BuyAbility℠ payment
Est. payment
$2,938/mo
Principal & interest
$2501
Property taxes
$437
More affordability tools
Climate risks
Neighborhood: Corky Row
Getting around
49 / 100
Some TransitNearby schools
GreatSchools rating
- 4/10Henry Lord Community SchoolGrades: PK-8Distance: 1.6 mi
- 2/10B M C Durfee High SchoolGrades: 9-12Distance: 2 mi
Local experts in 02721
Nearby cities
Nearby neighborhoods
Nearby zip codes
Other Fall River Topics
