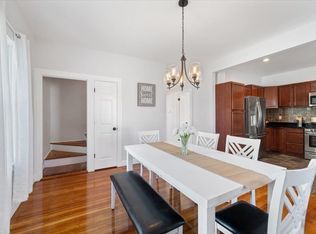
Welcome to 67 Garfield Street! This well-cared-for three-family home features three bedrooms in each unit, along with a living room and separate dining room, offering spacious and versatile layouts throughout. Two units will be delivered vacant, providing flexibility for an owner-occupant or investor. A driveway and carport provide convenient off-street parking, while the charming fenced-in backyard offers a cozy spot to relax or entertain. A great opportunity for an owner-occupant or investor looking to add to their portfolio!
For sale
$689,900
67 Garfield St, Fall River, MA 02721
9beds
3,783sqft
3 Family
Built in 1900
-- sqft lot
$677,700 Zestimate®
$182/sqft
$-- HOA
What's special
Separate dining roomCharming fenced-in backyardSpacious and versatile layouts
- 17 days
- 1,070
- 62
Likely to sell faster than
Zillow last checked:
Listing updated:
Listed by:
The Ponte Group 508-642-4802,
Keller Williams South Watuppa 508-677-3233,
Alexis Anselmo 508-415-7763
Source: MLS PIN,MLS#: 73598840
Facts & features
Interior
Bedrooms & bathrooms
- Bedrooms: 9
- Bathrooms: 4
- Full bathrooms: 4
Features
- Basement: Walk-Out Access,Interior Entry
- Has fireplace: No
Interior area
- Total structure area: 3,783
- Total interior livable area: 3,783 sqft
- Finished area above ground: 3,783
Property
Parking
- Total spaces: 3
- Parking features: Paved Drive
- Uncovered spaces: 3
Lot
- Size: 4,051 Square Feet
Details
- Parcel number: M:000E B:0002 L:0052,2823018
- Zoning: R-4
Construction
Type & style
- Home type: MultiFamily
- Property subtype: 3 Family
Materials
- Foundation: Block
Condition
- Year built: 1900
Utilities & green energy
- Sewer: Public Sewer
- Water: Public
Community & HOA
Location
- Region: Fall River
Financial & listing details
- Price per square foot: $182/sqft
- Tax assessed value: $490,600
- Annual tax amount: $5,632
- Date on market: 11/4/2026
- Total actual rent: 0
Estimated market value
$677,700
$644,000 - $712,000
$1,997/mo
Price history
| Date | Event | Price |
|---|---|---|
| 11/4/2026 | Listed for sale | $689,900+109.1%$182/sqft |
Source: MLS PIN #73598840 Report a problem | ||
| 2/6/2004 | Sold | $329,900$87/sqft |
Source: Public Record Report a problem | ||
Public tax history
| Year | Property taxes | Tax assessment |
|---|---|---|
| 2025 | $5,270 +4.4% | $460,300 +4.8% |
| 2024 | $5,046 +12.2% | $439,200 +19.8% |
| 2023 | $4,497 +12.6% | $366,500 +15.8% |
| 2022 | $3,995 +5.4% | $316,600 +15.5% |
| 2021 | $3,791 +10.5% | $274,100 +15.4% |
| 2020 | $3,432 +15.7% | $237,500 +16.8% |
| 2019 | $2,966 +6.6% | $203,400 +6.9% |
| 2018 | $2,782 +3.6% | $190,300 -0.8% |
| 2017 | $2,685 +5.2% | $191,800 +2.5% |
| 2016 | $2,552 -10.6% | $187,200 -14.2% |
| 2015 | $2,853 -3.5% | $218,100 -7.2% |
| 2014 | $2,955 +3.6% | $234,900 -1.7% |
| 2013 | $2,851 +6.4% | $239,000 -2.1% |
| 2012 | $2,680 +5.5% | $244,100 -13.1% |
| 2010 | $2,540 0% | $281,000 -10.9% |
| 2009 | $2,541 -4.9% | $315,300 -9.5% |
| 2008 | $2,672 +8.1% | $348,400 +1.2% |
| 2007 | $2,471 +11.6% | $344,100 +6.1% |
| 2006 | $2,215 +3.2% | $324,300 +15% |
| 2005 | $2,147 +21.4% | $282,100 +31% |
| 2004 | $1,768 +8.6% | $215,300 +41.6% |
| 2003 | $1,628 +8.8% | $152,000 |
| 2002 | $1,496 -1.8% | $152,000 +4.3% |
| 2000 | $1,524 +21% | $145,700 +6.3% |
| 1995 | $1,259 | $137,100 |
Find assessor info on the county website
Monthly payment
Est. payment
Payment breakdown
Explore the cost of this home by adjusting the details. Changes won't be saved.Climate risks
Neighborhood: Maplewood


Similar homes
- $639,9008 bd3 ba3.5k sqft498 Tecumseh St, Fall River, MA 02721For Sale
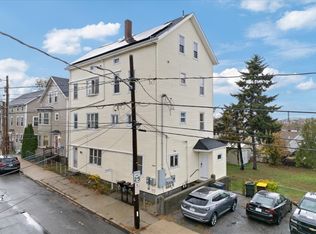 MLS ID #73600138, D. Brian Colville III, HomeSmart First Class Realty. MLS PIN
- $679,00011 bd4 ba3.4k sqft908 Plymouth Ave, Fall River, MA 02721For Sale
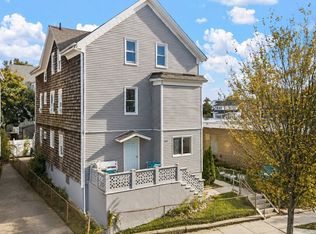 MLS ID #73594177, Malange DePina, Mikah Realty Group. MLS PIN
- $649,9999 bd3 ba2.7k sqft19 Lyon St, Fall River, MA 02721For Sale
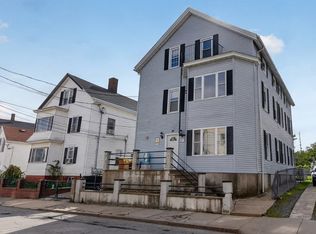 MLS ID #73599961, Kevin Teves, RE/MAX Vantage. MLS PIN
- $729,9999 bd3 ba3.9k sqft82 Snell St, Fall River, MA 02721For Sale
 MLS ID #73549786, Rollins Laurent, RE/MAX Synergy. MLS PIN
