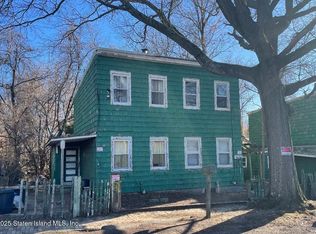
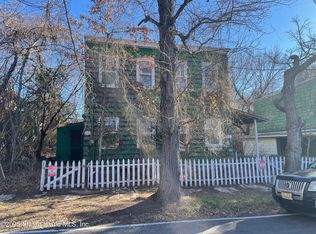
NEEDS WORK
Pending
$529,999
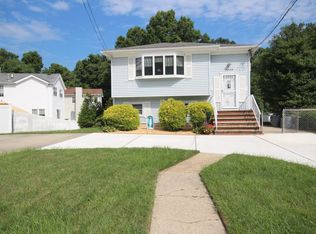
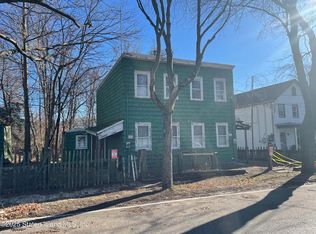
6716 Amboy Rd, Staten Island, NY 10309
3beds
2,248sqft
Single Family Residence
Built in 1930
0.26 Acres Lot
$882,700 Zestimate®
$236/sqft
$-- HOA
What's special
- 832 days |
- 29 |
- 3 |
Zillow last checked:
Listing updated:
Listing by:
AMR Properties 718-966-1700,
Rosalie Ferraro 646-206-1006
Source: SIBOR,MLS#: 1145851
Facts & features
Interior
Bedrooms & bathrooms
- Bedrooms: 3
- Bathrooms: 2
- Full bathrooms: 1
- 1/2 bathrooms: 1
Heating
- Hot Water, Natural Gas
Cooling
- Units
Interior area
- Total structure area: 2,248
- Total interior livable area: 2,248 sqft
Property
Parking
- Parking features: Off Street
Features
- Stories: 2
Lot
- Size: 0.26 Acres
- Dimensions: 68 x 167
Details
- Parcel number: 077520057
- Zoning: R3X
Construction
Type & style
- Home type: SingleFamily
- Architectural style: Colonial
- Property subtype: Single Family Residence
Materials
- Aluminum Siding
Condition
- New construction: No
- Year built: 1930
Utilities & green energy
- Electric: 110
- Sewer: Public Sewer
Community & HOA
Location
- Region: Staten Island
Financial & listing details
- Price per square foot: $236/sqft
- Tax assessed value: $716,000
- Annual tax amount: $5,848
- Date on market: 5/3/2021
- Listing agreement: Exclusive Right To Sell
Estimated market value
$882,700
$794,000 - $971,000
$3,946/mo
Price history
| Date | Event | Price |
|---|---|---|
| 5/29/2025 | Pending sale | $529,999$236/sqft |
Source: | ||
| 6/25/2021 | Listing removed | -- |
Source: | ||
| 6/25/2021 | Pending sale | $529,999$236/sqft |
Source: | ||
| 5/3/2021 | Listed for sale | $529,999+0.2%$236/sqft |
Source: | ||
| 1/1/2021 | Listing removed | -- |
Source: SIBOR Report a problem | ||
| 5/26/2020 | Price change | $529,000-3.6%$235/sqft |
Source: AMR Properties #1134366 Report a problem | ||
| 2/28/2020 | Price change | $549,000-3.5%$244/sqft |
Source: AMR Properties #1134366 Report a problem | ||
| 1/28/2020 | Price change | $569,000-5%$253/sqft |
Source: AMR Properties #1134366 Report a problem | ||
| 1/17/2020 | Price change | $599,000-4.9%$266/sqft |
Source: AMR Properties #1134366 Report a problem | ||
| 12/18/2019 | Price change | $629,999+56.8%$280/sqft |
Source: AMR Properties #1134366 Report a problem | ||
| 11/21/2019 | Price change | $401,674-27.3%$179/sqft |
Source: Auction.com Report a problem | ||
| 11/10/2019 | Price change | $552,695+0.1%$246/sqft |
Source: Auction.com Report a problem | ||
| 11/7/2019 | Price change | $552,381-0.1%$246/sqft |
Source: Auction.com Report a problem | ||
| 11/4/2019 | Price change | $552,768+0.2%$246/sqft |
Source: Auction.com Report a problem | ||
| 11/1/2019 | Price change | $551,530+1.5%$245/sqft |
Source: Auction.com Report a problem | ||
| 10/29/2019 | Price change | $543,350+0.1%$242/sqft |
Source: Auction.com Report a problem | ||
| 10/26/2019 | Price change | $542,558+181.1%$241/sqft |
Source: Auction.com Report a problem | ||
| 10/23/2019 | Listed for sale | -- |
Source: Auction.com Report a problem | ||
| 3/29/2001 | Sold | $193,000$86/sqft |
Source: Public Record Report a problem | ||
Public tax history
| Year | Property taxes | Tax assessment |
|---|---|---|
| 2025 | $7,142 +6% | $42,960 +7% |
| 2024 | $6,738 | $40,140 -4.4% |
| 2023 | -- | $42,000 -0.8% |
| 2022 | -- | $42,360 +9.5% |
| 2021 | -- | $38,700 -9.5% |
| 2020 | $5,613 +6.8% | $42,780 +8.5% |
| 2019 | $5,258 | $39,420 +49.5% |
| 2018 | -- | $26,374 |
| 2017 | $5,376 +177.4% | $26,374 +0.8% |
| 2016 | $1,938 | $26,174 +6% |
| 2015 | $1,938 +19.1% | $24,693 +6% |
| 2014 | $1,627 | $23,296 +6% |
| 2013 | -- | $21,979 |
| 2012 | -- | $21,979 +0.8% |
| 2011 | -- | $21,812 +6% |
| 2010 | -- | $20,578 +6% |
| 2009 | -- | $19,414 +6% |
| 2008 | -- | $18,316 |
| 2007 | -- | $18,316 +0.8% |
| 2006 | -- | $18,177 +6% |
| 2005 | -- | $17,149 +6% |
| 2004 | -- | $16,179 +6% |
| 2003 | -- | $15,264 |
| 2002 | -- | $15,264 +0.8% |
| 2001 | -- | $15,148 +6% |
| 2000 | -- | $14,291 |
Find assessor info on the county website
Monthly payment
Estimated monthly payment
All calculations are estimates and provided by Zillow, Inc. for informational purposes only. Actual amounts may vary.
HOA fees may include property taxes on listings classified as Co-Ops. Contact the listing agent and/or owner for fee details.
Mortgage interest rates are dependent on a number of factors, including credit score, down payment, and repayment length. Interest rate data provided by Zillow Group Marketplace, Inc. as of 1/1/1970 from various mortgage lenders with which we have lead or other similar arrangements; the Estimated Payment is an average of those rates.
See how much you could borrow to make a competitive offer.
Climate risks
Neighborhood: Richmond Valley
Nearby schools
GreatSchools rating
- 7/10Ps 3 The Margaret Gioiosa SchoolGrades: PK-5Distance: 0.8 mi
- 8/10Is 34 TottenvilleGrades: 6-8Distance: 1.2 mi
- 7/10Tottenville High SchoolGrades: 9-12Distance: 1.9 mi
A local agent can set up tours, give advice and negotiate with sellers.


Nearby cities
Nearby neighborhoods
Nearby zip codes
Other New York Topics
