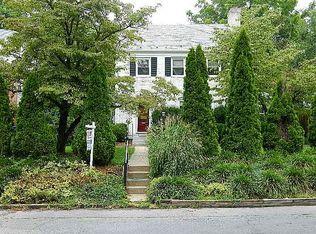
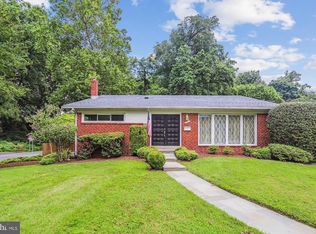
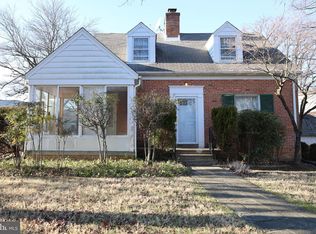
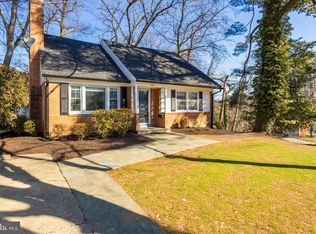
This 1504 square foot single family home has 3 bedrooms and 2.5 bathrooms. This home is located at 6720 Fairfax Rd, Chevy Chase, MD 20815.
Foreclosed
Est. $1,006,600
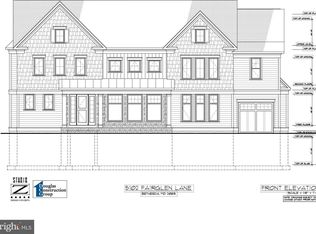
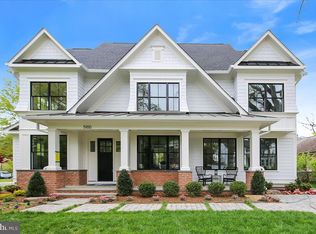
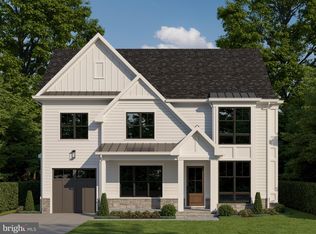
6720 Fairfax Rd, Chevy Chase, MD 20815
3beds
2baths
1,504sqft
SingleFamily
Built in 1948
5,227 Square Feet Lot
$1,006,600 Zestimate®
$669/sqft
$-- HOA
Overview
- 14 days |
- 27 |
- 2 |
Facts & features
Interior
Bedrooms & bathrooms
- Bedrooms: 3
- Bathrooms: 2.5
Heating
- Forced air
Cooling
- Central
Appliances
- Included: Dryer, Microwave, Range / Oven, Refrigerator
- Laundry: In Unit
Features
- Flooring: Hardwood
- Basement: Partially finished
- Has fireplace: Yes
Interior area
- Total interior livable area: 1,504 sqft
Property
Parking
- Total spaces: 1
- Parking features: Garage - Attached
Features
- Exterior features: Brick
Lot
- Size: 5,227 Square Feet
Details
- Parcel number: 0700446903
Construction
Type & style
- Home type: SingleFamily
- Architectural style: Conventional
Materials
- Frame
- Roof: Other
Condition
- New construction: No
- Year built: 1948
Community & HOA
Location
- Region: Chevy Chase
Financial & listing details
- Price per square foot: $669/sqft
- Tax assessed value: $821,333
- Annual tax amount: $10,200
Visit our professional directory to find a foreclosure specialist in your area that can help with your home search.
Find a foreclosure agentForeclosure details
Estimated market value
$1,006,600
$916,000 - $1.11M
$3,966/mo
Price history
Price history
| Date | Event | Price |
|---|---|---|
| 2/24/2026 | Sold | $1,029,013+17.6%$684/sqft |
Source: Public Record Report a problem | ||
| 3/21/2025 | Listing removed | $4,700$3/sqft |
Source: Bright MLS #MDMC2163936 Report a problem | ||
| 3/10/2025 | Price change | $4,700-4.1%$3/sqft |
Source: Bright MLS #MDMC2163936 Report a problem | ||
| 2/24/2025 | Listed for rent | $4,900+8.9%$3/sqft |
Source: Bright MLS #MDMC2163936 Report a problem | ||
| 11/9/2023 | Listing removed | -- |
Source: Bright MLS #MDMC2109780 Report a problem | ||
| 11/3/2023 | Listed for rent | $4,500$3/sqft |
Source: Bright MLS #MDMC2109780 Report a problem | ||
| 4/12/2023 | Listing removed | -- |
Source: Zillow Rentals #MDMC2082782 Report a problem | ||
| 3/20/2023 | Price change | $4,500-4.3%$3/sqft |
Source: Zillow Rentals #MDMC2082782 Report a problem | ||
| 3/7/2023 | Listed for rent | $4,700+4.4%$3/sqft |
Source: Zillow Rentals #MDMC2082782 Report a problem | ||
| 3/7/2022 | Listing removed | -- |
Source: | ||
| 2/22/2022 | Listed for rent | $4,500+12.5%$3/sqft |
Source: | ||
| 7/11/2020 | Listing removed | $4,000$3/sqft |
Source: Long & Foster Real Estate, Inc. #MDMC709130 Report a problem | ||
| 6/23/2020 | Listed for rent | $4,000$3/sqft |
Source: Long & Foster Real Estate, Inc. #MDMC709130 Report a problem | ||
| 5/20/2020 | Listing removed | $875,000$582/sqft |
Source: Long & Foster Real Estate, Inc. #MDMC683586 Report a problem | ||
| 12/7/2019 | Price change | $875,000-2.2%$582/sqft |
Source: Long & Foster Real Estate, Inc. #MDMC683586 Report a problem | ||
| 10/25/2019 | Listed for sale | $895,000+15.8%$595/sqft |
Source: Long & Foster Real Estate, Inc. #MDMC683586 Report a problem | ||
| 2/14/2019 | Listing removed | $772,7420%$514/sqft |
Source: Auction.com Report a problem | ||
| 2/11/2019 | Price change | $773,111$514/sqft |
Source: Auction.com Report a problem | ||
| 1/31/2019 | Listed for sale | -- |
Source: Auction.com Report a problem | ||
Public tax history
Public tax history
| Year | Property taxes | Tax assessment |
|---|---|---|
| 2025 | $10,200 +20.8% | $821,333 +12% |
| 2024 | $8,445 -0.1% | $733,600 |
| 2023 | $8,453 +4.4% | $733,600 |
| 2022 | $8,095 -11.1% | $733,600 -11.2% |
| 2021 | $9,104 +1.3% | $825,800 +1.3% |
| 2020 | $8,989 +2.8% | $814,833 +2.8% |
| 2019 | $8,743 -0.2% | $792,900 |
| 2018 | $8,759 +2.4% | $792,900 +5% |
| 2017 | $8,555 +33.5% | $755,200 +5.3% |
| 2016 | $6,406 | $717,500 +5.5% |
| 2015 | $6,406 | $679,800 +2.9% |
| 2014 | $6,406 | $660,333 +3% |
| 2013 | -- | $640,867 +3.1% |
| 2012 | -- | $621,400 |
| 2011 | -- | $621,400 |
| 2010 | -- | $621,400 -22.7% |
| 2009 | -- | $803,410 +9.4% |
| 2008 | -- | $734,386 +10.4% |
| 2007 | -- | $665,363 +11.6% |
| 2006 | -- | $596,340 +17.1% |
| 2005 | -- | $509,242 +20.6% |
| 2004 | -- | $422,146 +26% |
| 2003 | -- | $335,050 +6.9% |
| 2002 | -- | $313,286 |
| 2001 | -- | $313,286 |
Find assessor info on the county website
BuyAbility℠ payment
Estimated monthly payment
Boost your down payment with 6% savings match
Earn up to a 6% match & get a competitive APY with a *. Zillow has partnered with to help get you home faster.
Learn more*Terms apply. Match provided by Foyer. Account offered by Pacific West Bank, Member FDIC.Climate risks
Neighborhood: 20815
Nearby schools
GreatSchools rating
- 9/10Westbrook Elementary SchoolGrades: K-5Distance: 1.3 mi
- 10/10Westland Middle SchoolGrades: 6-8Distance: 1.2 mi
- 8/10Bethesda-Chevy Chase High SchoolGrades: 9-12Distance: 1 mi
Schools provided by the listing agent
- District: MONTGOMERY COUNTY PUBLIC SCHOOLS
Source: The MLS. This data may not be complete. We recommend contacting the local school district to confirm school assignments for this home.