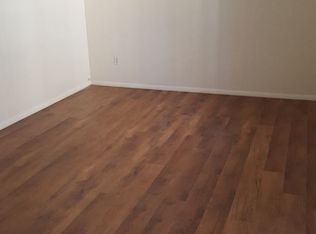
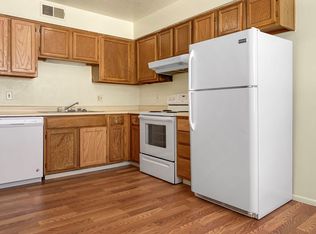
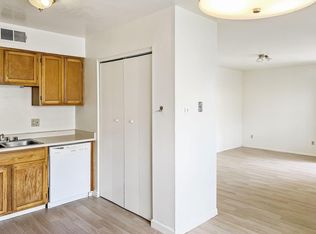
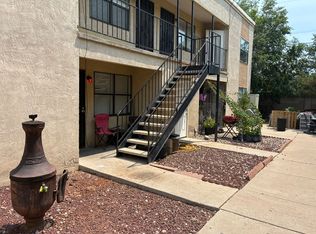
Great investment opportunity just 10 minutes from UNM and Nob Hill! This property features 2-bedroom, 1-bathroom units, individually metered for gas and electricity. Vacant units need some TLC, offering value-add potential to improve rental income and property value. Shares a courtyard with 538 Ortiz (MLS# 1112703 ), creating an excellent opportunity for a combined investment. Seller prefers to sell both properties together. Owner financing may be available. Please do not disturb tenants. Contact the listing agent for showing access.
For sale
$370,000
540 Ortiz Dr SE, Albuquerque, NM 87108
8beds
4baths
3,360sqft
Quadruplex, Multi Family
Built in 1983
-- sqft lot
$-- Zestimate®
$110/sqft
$-- HOA
What's special
- 5 days
- 187
- 25
Zillow last checked:
Listing updated:
Listed by:
Truc M Do 505-730-8499,
MORE Realty, Inc 505-333-9522
Source: SWMLS,MLS#: 1112705
Facts & features
Interior
Bedrooms & bathrooms
- Bedrooms: 8
- Bathrooms: 4
Heating
- Forced Air
Cooling
- Evaporative Cooling
Appliances
- Included: Dishwasher, Free-Standing Electric Range, Refrigerator, Range Hood, Self Cleaning Oven
Features
- Skylights
- Flooring: Laminate
- Windows: Skylight(s)
Interior area
- Total structure area: 3,360
- Total interior livable area: 3,360 sqft
Property
Features
- Levels: Two
- Stories: 2
Lot
- Size: 6,969 Square Feet
Details
- Parcel number: 101805604247522622
- Zoning description: R-MH*
Construction
Type & style
- Home type: MultiFamily
- Property subtype: Quadruplex, Multi Family
Materials
- Frame, Synthetic Stucco
Condition
- Resale
- New construction: No
- Year built: 1983
Utilities & green energy
- Utilities for property: Cable Available, Electricity Connected, Natural Gas Connected, Sewer Connected, Water Connected
Green energy
- Energy generation: None
Community & HOA
Community
- Features: Deck/Porch
- Security: Security Gate
Location
- Region: Albuquerque
Financial & listing details
- Price per square foot: $110/sqft
- Tax assessed value: $243,129
- Annual tax amount: $3,424
- Date on market: 10/18/2026
- Cumulative days on market: 91 days
- Listing terms: Cash,Conventional,FHA,Owner May Carry
- Total actual rent: 2300
- Tenant pays: Electricity, Gas
Estimated market value
Not available
Estimated sales range
Not available
$1,024/mo
Price history
| Date | Event | Price |
|---|---|---|
| 10/19/2026 | Listed for sale | $370,000-2.6%$110/sqft |
Source:  SWMLS #1112705 Report a problem | ||
| 10/2/2026 | Listing removed | $379,900$113/sqft |
Source: SWMLS #1106771 Report a problem | ||
| 8/21/2026 | Price change | $379,900-3.8%$113/sqft |
Source: SWMLS #1106771 Report a problem | ||
| 8/6/2026 | Price change | $395,000-2.5%$118/sqft |
Source: SWMLS #1106771 Report a problem | ||
| 7/24/2026 | Listed for sale | $405,000$121/sqft |
Source: SWMLS #1106771 Report a problem | ||
| 7/21/2026 | Pending sale | $405,000$121/sqft |
Source: SWMLS #1106771 Report a problem | ||
| 7/6/2026 | Listed for sale | $405,000+109.8%$121/sqft |
Source: SWMLS #1106771 Report a problem | ||
| 9/5/2018 | Sold | -- |
Source: Agent Provided Report a problem | ||
| 7/7/2018 | Pending sale | $193,000$57/sqft |
Source: Cottonwood Realty #921607 Report a problem | ||
| 6/18/2018 | Listed for sale | $193,000$57/sqft |
Source: Cottonwood Realty #921607 Report a problem | ||
| 6/17/2016 | Listing removed | $480-3% |
Source: TG&W Agency, LLC Report a problem | ||
| 3/16/2016 | Price change | $495-2% |
Source: TG&W Agency, LLC Report a problem | ||
| 3/2/2016 | Price change | $505+4.1% |
Source: TG&W Agency, LLC Report a problem | ||
| 2/2/2016 | Price change | $485-3% |
Source: TG&W Agency, LLC Report a problem | ||
| 1/13/2016 | Price change | $500-2.9% |
Source: TG&W Agency, LLC Report a problem | ||
| 1/5/2016 | Listed for rent | $515+8.4% |
Source: TG&W Agency, LLC Report a problem | ||
| 11/6/2015 | Listing removed | $475 |
Source: TG&W Agency, LLC Report a problem | ||
| 11/5/2015 | Listed for rent | $475 |
Source: TG&W Agency, LLC Report a problem | ||
Public tax history
| Year | Property taxes | Tax assessment |
|---|---|---|
| 2025 | $3,424 +3.2% | $81,035 +3% |
| 2024 | $3,319 +1.7% | $78,675 +3% |
| 2023 | $3,264 +3.5% | $76,384 +3% |
| 2022 | $3,154 +15.7% | $74,160 +15.2% |
| 2021 | $2,725 +1.7% | $64,369 +3% |
| 2020 | $2,681 | $62,494 -1% |
| 2019 | -- | $63,094 |
| 2018 | $1,840 -8.4% | $63,094 +33.9% |
| 2017 | $2,008 +6.2% | $47,133 +6.1% |
| 2016 | $1,890 -95.6% | $44,428 +3% |
| 2015 | $43,134 +2325.6% | $43,134 +3% |
| 2014 | $1,778 | $41,878 +3% |
| 2013 | $1,778 | $40,659 -20.7% |
| 2012 | -- | $51,302 |
| 2011 | -- | $51,302 |
| 2010 | -- | $51,302 +42% |
| 2009 | -- | $36,125 +3% |
| 2008 | -- | $35,074 +3% |
| 2007 | -- | $34,052 +3% |
| 2006 | -- | $33,061 +3% |
| 2005 | -- | $32,098 +3% |
| 2004 | -- | $31,164 -39.1% |
| 2003 | -- | $51,201 +3% |
| 2002 | -- | $49,710 +3% |
| 2001 | -- | $48,262 +15.4% |
| 2000 | -- | $41,830 |
Find assessor info on the county website
Monthly payment
Est. payment
Payment breakdown
Explore the cost of this home by adjusting the details. Changes won't be saved.Climate risks
Neighborhood: South San Pedro
Similar homes
- $370,0008 bd4 ba3.3k sqft538 Ortiz Dr SE, Albuquerque, NM 87108For Sale
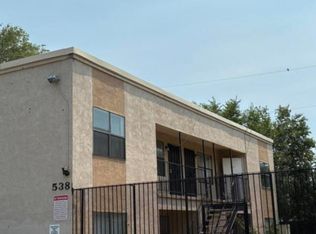 MLS ID #1112703, Truc M Do, MORE Realty, Inc. SWMLS
- $420,0008 bd4 ba3.1k sqft532 Palomas Dr SE, Albuquerque, NM 87108For Sale
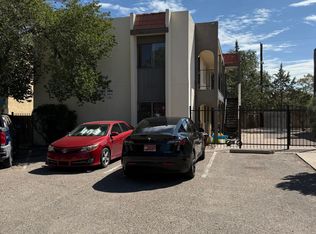 MLS ID #1110497, Tyler M Pete, EXP Realty LLC. SWMLS
- $349,9007 bd4 ba2.6k sqft209 Texas St NE, Albuquerque, NM 87108For Sale
 MLS ID #1104238, Tahir Gauba, MORE Realty, Inc. SWMLS
- $349,9006 bd4 ba2.5k sqft211 Texas St NE, Albuquerque, NM 87108For Sale
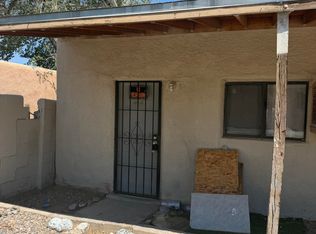 MLS ID #1108757, Tahir Gauba, MORE Realty, Inc. SWMLS
