$100,200
2 bd|1 ba|818 sqft
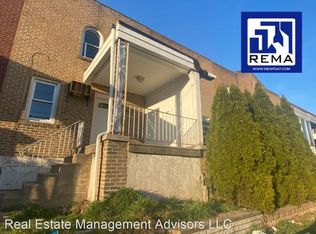
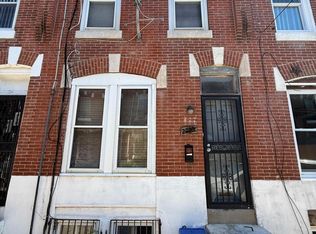
7017 Guilford Rd, Upper Darby, PA 19082
Off Market
Zillow last checked:
Listing updated:
Ari Miller 215-914-0700,
Real Estate Management Advisors LLC 2159140700
$149,800
$142,000 - $157,000
$1,321/mo
| Date | Event | Price |
|---|---|---|
| 6/26/2026 | Listed for sale | $149,000+144.3%$182/sqft |
Source: | ||
| 2/22/2023 | Listing removed | -- |
Source: Zillow Rentals Report a problem | ||
| 2/6/2023 | Listed for rent | $1,350$2/sqft |
Source: Zillow Rentals Report a problem | ||
| 4/16/2021 | Sold | $61,000+35.6%$75/sqft |
Source: Public Record Report a problem | ||
| 8/1/2014 | Listing removed | $45,000$55/sqft |
Source: CENTURY 21 Alliance #6346101 Report a problem | ||
| 3/5/2014 | Listed for sale | $45,000+80%$55/sqft |
Source: CENTURY 21 Alliance #6346101 Report a problem | ||
| 4/7/2012 | Listing removed | $25,000$31/sqft |
Source: Keller Williams Real Estate #5972312 Report a problem | ||
| 3/16/2012 | Price change | $25,000+16.3%$31/sqft |
Source: Keller Williams Real Estate #5972312 Report a problem | ||
| 2/12/2012 | Price change | $21,500-25.9%$26/sqft |
Source: Keller Williams Real Estate #5972312 Report a problem | ||
| 1/24/2012 | Price change | $29,000-35.4%$35/sqft |
Source: Keller Williams Real Estate #5972312 Report a problem | ||
| 11/16/2011 | Listed for sale | $44,900+648.3%$55/sqft |
Source: Keller Williams Real Estate #5972312 Report a problem | ||
| 1/29/2010 | Sold | $6,000-90.5%$7/sqft |
Source: Public Record Report a problem | ||
| 4/7/2005 | Sold | $63,000$77/sqft |
Source: Public Record Report a problem | ||
| Year | Property taxes | Tax assessment |
|---|---|---|
| 2025 | $2,493 +3.5% | $56,960 |
| 2024 | $2,409 +1% | $56,960 |
| 2023 | $2,386 +2.8% | $56,960 |
| 2022 | $2,322 | $56,960 |
| 2021 | $2,322 +1010.5% | $56,960 +48.8% |
| 2020 | $209 -91.4% | $38,290 |
| 2019 | $2,433 +1.2% | $38,290 |
| 2018 | $2,405 +1044.7% | $38,290 |
| 2017 | $210 | $38,290 |
| 2016 | $210 -2% | $38,290 |
| 2015 | $214 | $38,290 |
| 2014 | $214 +2.8% | $38,290 |
| 2013 | $209 +4.9% | $38,290 |
| 2012 | $199 +0.3% | $38,290 |
| 2011 | $198 +2% | $38,290 |
| 2010 | $194 +7.5% | $38,290 |
| 2009 | $181 | $38,290 |
| 2008 | $181 +6.1% | $38,290 |
| 2007 | $170 | $38,290 |
| 2006 | $170 | $38,290 |
| 2005 | $170 | $38,290 |
| 2004 | $170 +8.5% | $38,290 |
| 2003 | $157 +7.9% | $38,290 |
| 2002 | $146 | $38,290 |
| 2000 | $146 | $38,290 |
Find assessor info on the county website
Source: Bright MLS. This data may not be complete. We recommend contacting the local school district to confirm school assignments for this home.
A local agent can set up tours, give advice and negotiate with sellers.