This home is a Real Estate Owned (REO)/Post Foreclosure. Once a lender has foreclosed on a property it is soon put up for public auction. If bids fall short of the asking price the bank will buy back the home and attempt to sell it on the open market. However, lenders are not real estate agents, meaning that they will often accept offers 30 to 60 percent less than market value!
Pre-foreclosure
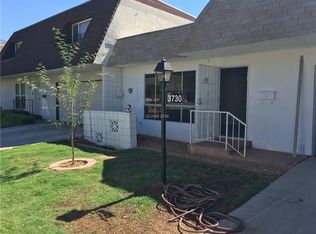
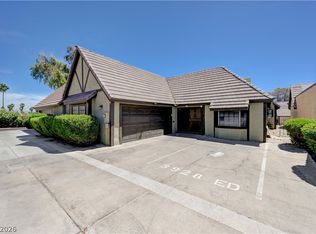
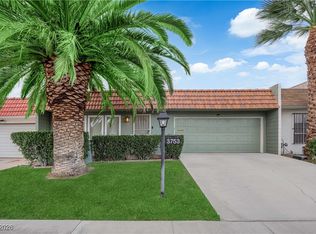
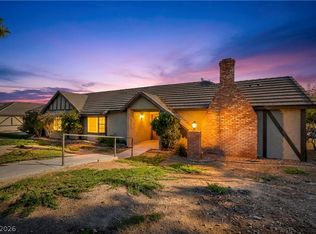
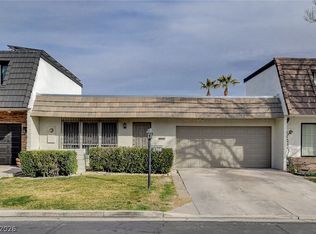
Street View
Est. $345,600
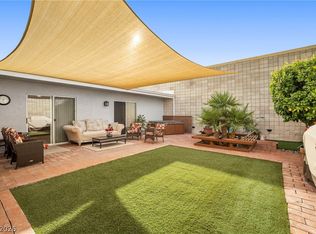
3719 Centennial Cir, Las Vegas, NV 89121
2beds
2baths
2,169sqft
Townhouse
Built in 1971
3,920 Square Feet Lot
$345,600 Zestimate®
$159/sqft
$141/mo HOA
Overview
- 152 days |
- 228 |
- 7 |
Facts & features
Interior
Bedrooms & bathrooms
- Bedrooms: 2
- Bathrooms: 2
Heating
- Forced air
Cooling
- Central
Features
- Flooring: Carpet, Concrete, Linoleum / Vinyl
Interior area
- Total interior livable area: 2,169 sqft
Property
Parking
- Parking features: Garage - Attached
Features
- Exterior features: Stucco
Lot
- Size: 3,920 Square Feet
Details
- Parcel number: 16118311195
Construction
Type & style
- Home type: Townhouse
Materials
- masonry
- Roof: Built-up
Condition
- Year built: 1971
Community & HOA
HOA
- Has HOA: Yes
- HOA fee: $141 monthly
Location
- Region: Las Vegas
Financial & listing details
- Price per square foot: $159/sqft
- Tax assessed value: $169,334
- Annual tax amount: $1,300
Visit our professional directory to find a foreclosure specialist in your area that can help with your home search.
Find a foreclosure agentForeclosure details
Estimated market value
$345,600
$328,000 - $363,000
$2,204/mo
Price history
Price history
| Date | Event | Price |
|---|---|---|
| 7/1/2025 | Listing removed | $354,999$164/sqft |
Source: | ||
| 6/4/2025 | Price change | $354,9990%$164/sqft |
Source: | ||
| 4/20/2025 | Listed for sale | $355,000-1.4%$164/sqft |
Source: | ||
| 4/12/2025 | Listing removed | $360,000$166/sqft |
Source: | ||
| 3/21/2025 | Price change | $360,000-1.4%$166/sqft |
Source: | ||
| 3/5/2025 | Price change | $364,9990%$168/sqft |
Source: | ||
| 2/19/2025 | Price change | $365,000-2.7%$168/sqft |
Source: | ||
| 1/23/2025 | Price change | $375,000-1.3%$173/sqft |
Source: | ||
| 12/20/2024 | Listed for sale | $380,000+4.1%$175/sqft |
Source: | ||
| 3/10/2022 | Sold | $365,000+5.8%$168/sqft |
Source: | ||
| 2/8/2022 | Pending sale | $345,000$159/sqft |
Source: | ||
| 2/4/2022 | Listed for sale | $345,000+222.4%$159/sqft |
Source: | ||
| 9/21/2011 | Sold | $107,000+52.9%$49/sqft |
Source: Public Record Report a problem | ||
| 9/29/2009 | Sold | $70,000-25.9%$32/sqft |
Source: Public Record Report a problem | ||
| 7/23/2009 | Sold | $94,500-9.1%$44/sqft |
Source: Public Record Report a problem | ||
| 2/10/1994 | Sold | $104,000$48/sqft |
Source: Public Record Report a problem | ||
Public tax history
Public tax history
| Year | Property taxes | Tax assessment |
|---|---|---|
| 2025 | $1,300 +7.9% | $59,267 +5.3% |
| 2024 | $1,204 +8% | $56,307 +14.7% |
| 2023 | $1,115 +7.7% | $49,077 +17.9% |
| 2022 | $1,036 +8.1% | $41,633 +1% |
| 2021 | $959 +6.8% | $41,214 +5.8% |
| 2020 | $898 +4.8% | $38,968 +7.6% |
| 2019 | $857 +6.9% | $36,202 |
| 2018 | $802 | $36,202 +3.7% |
| 2017 | $802 | $34,925 +11.4% |
| 2016 | $802 +0.4% | $31,338 -0.5% |
| 2015 | $799 +3.2% | $31,494 +26.1% |
| 2014 | $774 | $24,985 |
| 2013 | -- | $24,985 -2.9% |
| 2012 | -- | $25,723 -18.3% |
| 2011 | -- | $31,479 +5.3% |
| 2010 | -- | $29,888 -36.2% |
| 2009 | -- | $46,849 |
| 2008 | -- | $46,849 -20.9% |
| 2007 | -- | $59,216 +17.4% |
| 2006 | -- | $50,419 +39.5% |
| 2005 | -- | $36,138 +14.1% |
| 2004 | -- | $31,669 +0.7% |
| 2003 | -- | $31,455 -3% |
| 2002 | -- | $32,430 +4.9% |
| 2001 | -- | $30,920 |
Find assessor info on the county website
Monthly payment
Estimated monthly payment
All calculations are estimates and provided by Zillow, Inc. for informational purposes only. Actual amounts may vary.
HOA fees may include property taxes on listings classified as Co-Ops. Contact the listing agent and/or owner for fee details.
Mortgage interest rates are dependent on a number of factors, including credit score, down payment, and repayment length. Interest rate data provided by Zillow Group Marketplace, Inc. as of 1/1/1970 from various mortgage lenders with which we have lead or other similar arrangements; the Estimated Payment is an average of those rates.
See how much you could borrow to make a competitive offer.
Climate risks
Neighborhood: Paradise
Nearby schools
GreatSchools rating
- 3/10George E Harris Elementary SchoolGrades: PK-5Distance: 0.1 mi
- 3/10C W Woodbury Middle SchoolGrades: 6-8Distance: 1.1 mi
- 2/10Chaparral High SchoolGrades: 9-12Distance: 0.4 mi
- Nevada
- Clark County
- Las Vegas
- 89121
- Paradise
- 3719 Centennial Cir
Nearby cities
Nearby neighborhoods
Nearby zip codes
Other Las Vegas Topics
