This main st lot holds what used to be a small general store with living quarters. Across from a historic church and just a couple of blocks from the beautiful ball park. Walking distance to the current convienent store. A great lot for your tiny house rebuild in a close knit community.
Active
$30,000
7186 Standish Rd, Bentley, MI 48613
3beds
1,000sqft
Single Family Residence
Built in 1910
8,712 Square Feet Lot
$-- Zestimate®
$30/sqft
$-- HOA
What's special
- 34 days
- 662
- 10
Zillow last checked:
Listing updated:
Listed by:
Fawn Near 989-708-6665,
The Kelder Group LLC 810-503-1163
Source: MichRIC,MLS#: 26051105
Facts & features
Interior
Bedrooms & bathrooms
- Bedrooms: 3
- Bathrooms: 2
- Full bathrooms: 2
Heating
- Forced Air
Appliances
- Laundry: See Remarks
Features
- Basement: Crawl Space,Slab
- Has fireplace: No
Interior area
- Total structure area: 1,000
- Total interior livable area: 1,000 sqft
Property
Features
- Stories: 2
Lot
- Size: 8,712 Square Feet
- Dimensions: 69' x 124'
Details
- Parcel number: 09060B0500800900
Construction
Type & style
- Home type: SingleFamily
- Property subtype: Single Family Residence
Materials
- Wood Siding
Condition
- New construction: No
- Year built: 1910
Utilities & green energy
- Water: Well
Community & HOA
Location
- Region: Bentley
Financial & listing details
- Price per square foot: $30/sqft
- Tax assessed value: $2,668
- Annual tax amount: $296
- Date on market: 9/25/2026
- Listing terms: Cash
Estimated market value
Not available
Estimated sales range
Not available
$1,298/mo
Price history
| Date | Event | Price |
|---|---|---|
| 9/25/2026 | Listed for sale | $30,000+215.8%$30/sqft |
Source:  MichRIC #26051105 Report a problem | ||
| 6/26/2021 | Sold | $9,500$10/sqft |
Source:  MiRealSource #50043161 Report a problem | ||
Public tax history
| Year | Property taxes | Tax assessment |
|---|---|---|
| 2025 | $325 +3.1% | $3,600 +12.5% |
| 2024 | $315 +6.3% | $3,200 +33.3% |
| 2023 | $296 +8.5% | $2,400 -7.7% |
| 2022 | $273 +11.8% | $2,600 +18.2% |
| 2021 | $244 +5.5% | $2,200 +10% |
| 2020 | $232 +2.5% | $2,000 +5.3% |
| 2019 | $226 | $1,900 -9.5% |
| 2018 | $226 -9.2% | $2,100 +10.5% |
| 2017 | $249 | $1,900 +5.6% |
| 2016 | $249 | $1,800 +12.5% |
| 2015 | $249 | $1,600 |
| 2014 | -- | $1,600 +166.7% |
| 2013 | -- | $600 -64.7% |
| 2012 | -- | $1,700 -10.5% |
| 2011 | -- | $1,900 -81.4% |
| 2010 | -- | $10,200 -37.4% |
| 2009 | -- | $16,300 -6.9% |
| 2008 | -- | $17,500 +0.3% |
| 2007 | -- | $17,450 +13.3% |
| 2006 | -- | $15,400 +6.6% |
| 2005 | -- | $14,450 +3.2% |
| 2004 | -- | $14,000 +1.1% |
| 2003 | -- | $13,850 +3% |
| 2002 | -- | $13,450 +12.1% |
| 2001 | -- | $12,000 |
Find assessor info on the county website
Monthly payment
Est. payment
Payment breakdown
Explore the cost of this home by adjusting the details. Changes won't be saved.Climate risks
Neighborhood: 48613
Similar homes
- $39,9003 bd1 ba1.2k sqft2685 S Whitney Beach Rd, Beaverton, MI 48612For Sale By Owner
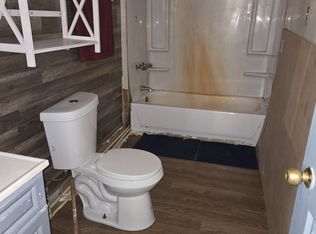
- $40,0003 bd2 ba1.2k sqft3960 McCullum Rd, Beaverton, MI 48612New Construction

 MLS ID #50208769, Jenni Reid, EXP REALTY. MiRealSource
- $45,0003 bd1 ba1.3k sqft317 Oak St, Gladwin, MI 48624For Sale By Owner
- $39,9002 bd1 ba700 sqft4930 S Hickory St, Beaverton, MI 48612For Sale
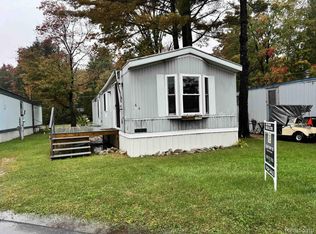
 MLS ID #20261083206, Amy Morgan, Century 21 Signature Realty. Realcomp II
- $39,9002 bd1 ba1.2k sqft4936 S Walnut St Lot 93, Beaverton, MI 48612For SaleMLS ID #20261070589, Christopher Auge, Century 21 Signature Realty. Realcomp II
