Attention: 3 beds, 1 baths single family home in Lakeland that can be converted to a 3/2
Huge Lot( 0.62 acres)
For sale
$139,000
725 W Socrum Loop Rd, Lakeland, FL 33809
2beds
1,332sqft
Single Family Residence
Built in 1947
0.62 Acres Lot
$-- Zestimate®
$104/sqft
$-- HOA
What's special
- 12 days
- 582
- 40
Likely to sell faster than
Zillow last checked:
Listing updated:
Listed by:
Steven Koleno 630-405-8314,
Beycome Of Florida LLC
Source: Realtors Association of Citrus County,MLS#: 858635 Originating MLS: Realtors Association of Citrus County
Facts & features
Interior
Bedrooms & bathrooms
- Bedrooms: 2
- Bathrooms: 1
- Full bathrooms: 1
Bedroom
- Level: Main
- Dimensions: 9.00 x 9.00
Bedroom
- Level: Main
- Dimensions: 9.00 x 9.00
Living room
- Level: Main
- Dimensions: 20.00 x 15.00
Cooling
- Central Air
Appliances
- Included: None
Features
- Flooring: Laminate
Interior area
- Total structure area: 1,332
- Total interior livable area: 1,332 sqft
Property
Parking
- Total spaces: 1
- Parking features: Detached Carport, Unassigned
- Has carport: Yes
Features
- Levels: One
- Stories: 1
- Pool features: None
Lot
- Size: 0.62 Acres
- Features: Acreage
Details
- Parcel number: 232712000000031130
- Zoning: R1
- Special conditions: Standard
Construction
Type & style
- Home type: SingleFamily
- Architectural style: One Story
- Property subtype: Single Family Residence
Materials
- Frame
- Roof: Asphalt,Shingle
Condition
- New construction: No
- Year built: 1947
Utilities & green energy
- Sewer: Septic Needed
- Water: Well Needed
Community & HOA
Community
- Subdivision: Not on List
HOA
- Has HOA: No
Location
- Region: Lakeland
Financial & listing details
- Price per square foot: $104/sqft
- Tax assessed value: $144,689
- Annual tax amount: $1,871
- Date on market: 10/16/2026
- Listing terms: Cash
Estimated market value
Not available
Estimated sales range
Not available
Not available
Price history
| Date | Event | Price |
|---|---|---|
| 10/16/2026 | Listed for sale | $139,000-7.3%$104/sqft |
Source:  Realtors Association of Citrus County #858635 Report a problem | ||
| 6/11/2026 | Listing removed | $150,000$113/sqft |
Source:  Stellar MLS #P4937224 Report a problem | ||
| 5/31/2026 | Price change | $150,000-11.2%$113/sqft |
Source: Stellar MLS #P4937224 Report a problem | ||
| 2/2/2026 | Price change | $169,000-6.1%$127/sqft |
Source: Stellar MLS #P4937224 Report a problem | ||
| 12/7/2025 | Listed for sale | $179,900+1283.8%$135/sqft |
Source: Stellar MLS #P4937224 Report a problem | ||
| 8/12/1996 | Sold | $13,000$10/sqft |
Source: Public Record Report a problem | ||
Public tax history
| Year | Property taxes | Tax assessment |
|---|---|---|
| 2025 | $1,871 +3.6% | $144,689 +6.3% |
| 2024 | $1,805 +10.2% | $136,146 +10% |
| 2023 | $1,638 +9.6% | $123,769 +10% |
| 2022 | $1,495 +42.3% | $112,517 +63.3% |
| 2021 | $1,051 +9.3% | $68,894 +10% |
| 2020 | $961 +7.4% | $62,631 +10% |
| 2019 | $895 -31.6% | $56,937 -15.8% |
| 2018 | $1,308 +5.2% | $67,583 +43.6% |
| 2017 | $1,244 +80.3% | $47,055 +10% |
| 2016 | $690 +4.3% | $42,777 +10% |
| 2015 | $661 -25.5% | $38,888 +10% |
| 2014 | $888 +63% | $35,353 +10% |
| 2013 | $545 +21.2% | $32,139 +10% |
| 2012 | $449 +2031.2% | $29,217 +8.8% |
| 2011 | $21 +40.4% | $26,855 +1.5% |
| 2010 | $15 +243.7% | $26,458 +2.7% |
| 2009 | $4 +19.4% | $25,762 +0.1% |
| 2008 | $4 | $25,736 |
| 2007 | -- | -- |
| 2006 | -- | -- |
| 2005 | -- | -- |
| 2004 | -- | -- |
| 2003 | -- | $23,091 +4.9% |
| 2002 | -- | $22,021 +1.6% |
| 2001 | -- | $21,674 |
Find assessor info on the county website
Monthly payment
Est. payment
Payment breakdown
Explore the cost of this home by adjusting the details. Changes won't be saved.Climate risks
Neighborhood: 33809

Similar homes
- $119,9002 bd2 ba1.2k sqft310 MARTIN DRIVE, LAKELAND, FL 33809For Sale
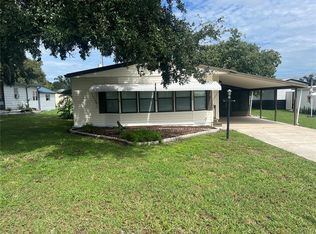
 MLS ID #L4965557, Twinkle Robinson, LA ROSA REALTY PRESTIGE. Stellar MLS
- $169,0003 bd2 ba1.2k sqft1525 PINEFORD ROAD, LAKELAND, FL 33809For Sale
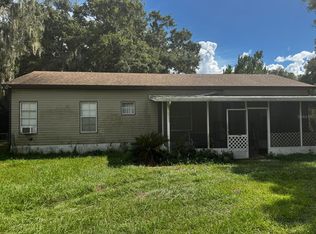 MLS ID #P4939800, Lucy Martinez, KELLER WILLIAMS REALTY SMART 1. Stellar MLS
- $110,0002 bd2 ba680 sqft1102 W 13TH STREET, LAKELAND, FL 33805For Sale
 MLS ID #O6326715, Kam Anderson, ABSOLUTE REALTY GROUP, LLC. Stellar MLS
- $160,0003 bd2 ba1.5k sqft1049 PLATEAU AVENUE, LAKELAND, FL 33815For Sale
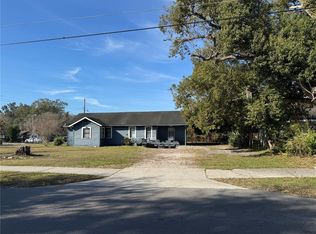 MLS ID #L4958607, Donna Williams, RE/MAX EXPERTS. Stellar MLS
- $115,0002 bd1 ba768 sqft2516 E MAGNOLIA STREET, LAKELAND, FL 33801For SaleMLS ID #O6431563, Ana Dos Santos, LOKATION. Stellar MLS
- $199,0002 bd2 ba1.1k sqft2014 W HICKORY STREET, LAKELAND, FL 33815For SaleMLS ID #O6450002, Juan Angel Tobon, LINK PRO REAL ESTATE LLC. Stellar MLS
- $187,5002 bd2 ba923 sqft519 CHANNING ROAD, LAKELAND, FL 33805For SaleMLS ID #TB8549471, Alexandra Muneton, AXEN REALTY LLC. Stellar MLS
- $130,0002 bd2 ba1.1k sqft1130 N LAKE PARKER AVENUE #A208, LAKELAND, FL 33805For SaleMLS ID #L4962876, Don Jerue, KELLER WILLIAMS REALTY SMART 1. Stellar MLS
- $180,0003 bd2 ba1k sqft1615 BLOSSOM CIRCLE E, LAKELAND, FL 33805For SaleMLS ID #TB8554833, Jack Dinh, DALTON WADE INC. Stellar MLS
- $198,9993 bd2 ba924 sqft4015 SHADY OAK DRIVE E, LAKELAND, FL 33809For SaleMLS ID #O6436961, Marisela Barazarte Moron, LA ROSA REALTY PREMIER LLC. Stellar MLS
- $170,0003 bd1 ba746 sqft915 N WABASH AVENUE, LAKELAND, FL 33815For SaleMLS ID #L4965519, Emory Dant, Jr, KELLER WILLIAMS REALTY. Stellar MLS
- $130,0003 bd2 ba1.6k sqft1406 MEADOW DRIVE NE, WINTER HAVEN, FL 33881For SaleMLS ID #S5159385, Cesar Estrada, PA, EXP REALTY LLC. Stellar MLS
- $140,0003 bd1 ba1.1k sqft1220 33RD STREET NW, WINTER HAVEN, FL 33881For SaleMLS ID #S5157386, Cesar Estrada, PA, EXP REALTY LLC. Stellar MLS
- $184,0002 bd1 ba786 sqft1427 PLEASANT PLACE, LAKELAND, FL 33801For SaleMLS ID #TB8501958, Bradley Dreher, GRAYSTONE REAL ESTATE. Stellar MLS
- $200,0002 bd2 ba1.3k sqftLakeside Hills Estates, Lakeland, FL 33809For Sale
 MLS ID #A12090328, Mark Thews, Equitable Company Realtors. MIAMI
- $139,9002 bd2 ba892 sqft4534 SEABERG ROAD, ZEPHYRHILLS, FL 33541For SaleMLS ID #TB8510591, Jeff Reutimann, REUTIMANN REALTY. Stellar MLS
- $199,9003 bd2 ba1.4k sqft1572 CHURCHILL COURT, LAKELAND, FL 33801For SaleMLS ID #P4940062, Malak Hassani Benbachir, KELLER WILLIAMS REALTY SMART 1. Stellar MLS
- $175,0002 bd1 ba843 sqft515 MONTICELLO AVENUE, LAKELAND, FL 33801For SaleMLS ID #O6442771, Laurie Cain, CHARLES RUTENBERG REALTY ORLANDO. Stellar MLS
- $150,0002 bd2 ba1k sqft34405 COUNTRYSIDE DRIVE, WESLEY CHAPEL, FL 33543For SaleMLS ID #S5160070, Tabatha Ramos, TURNKEY HOMES REAL ESTATE CORP. Stellar MLS
