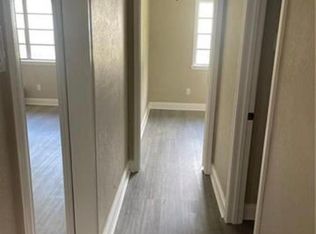
Excellent house-hack or investment opportunity in the Holy Cross area! This triplex features three 2 bedroom / 1 bath units and offers the perfect setup for the owner-occupant or investor looking to generate strong rental income.
Two units are currently leased at $1400/month, producing immediate income, while the third unit is vacant and ready for light cosmetic updates.
Live in one unit and let the other two help pay your mortgage, or lease the third unit to bring total potential rents to approximately $4200/month.
Located just minutes from the French Quarter, Bywater, and downtown New Orleans, with growing demand for multi-family housing in the area.
Active
$324,900
5335 Burgundy St, New Orleans, LA 70117
6beds
2,356sqft
Triplex, Multi Family, Multi Family
Built in 1980
-- sqft lot
$314,600 Zestimate®
$138/sqft
$-- HOA
What's special
- 218 days
- 22
- 1
Zillow last checked:
Listing updated:
Listed by:
Jaime Wright 305-962-6201,
Boyd Realtors, LLC 504-533-8701
Source: GSREIN,MLS#: 2546756
Facts & features
Interior
Bedrooms & bathrooms
- Bedrooms: 6
- Bathrooms: 3
- Full bathrooms: 3
Heating
- Window Unit
Cooling
- Window Unit(s)
Appliances
- Laundry: None
Interior area
- Total interior livable area: 2,356 sqft
Property
Parking
- Total spaces: 2
- Parking features: Two Spaces
Features
- Levels: One
- Stories: 1
Lot
- Size: 6,838 Square Feet
- Dimensions: 60 x 114
- Features: 1 to 5 Acres, City Lot
Details
- Parcel number: 39W202601
- Special conditions: None
Construction
Type & style
- Home type: MultiFamily
- Architectural style: Ranch
- Property subtype: Triplex, Multi Family, Multi Family
Materials
- Brick
- Foundation: Slab
- Roof: Asphalt
Condition
- Average Condition
- Year built: 1980
Utilities & green energy
- Sewer: Public Sewer
- Water: Public
Community & HOA
Location
- Region: New Orleans
Financial & listing details
- Price per square foot: $138/sqft
- Tax assessed value: $152,000
- Annual tax amount: $2,006
- Date on market: 3/9/2026
Estimated market value
$314,600
$299,000 - $330,000
$1,756/mo
Price history
| Date | Event | Price |
|---|---|---|
| 6/28/2026 | Price change | $324,900-7.1%$138/sqft |
Source:  GSREIN #2546756 Report a problem | ||
| 5/10/2026 | Listing removed | $900 |
Source: Zillow Rentals Report a problem | ||
| 5/5/2026 | Listed for rent | $900-16.3% |
Source: Zillow Rentals Report a problem | ||
| 4/16/2026 | Listing removed | $1,075 |
Source: Zillow Rentals Report a problem | ||
| 4/14/2026 | Listed for rent | $1,075-12.2% |
Source: Zillow Rentals Report a problem | ||
| 3/19/2026 | Listed for sale | $349,900+125.7%$149/sqft |
Source: GSREIN #2546756 Report a problem | ||
| 2/23/2026 | Listing removed | $1,225$1/sqft |
Source: Zillow Rentals Report a problem | ||
| 2/20/2026 | Listed for rent | $1,225$1/sqft |
Source: Zillow Rentals Report a problem | ||
| 2/20/2026 | Listing removed | $1,225$1/sqft |
Source: Zillow Rentals Report a problem | ||
| 2/5/2026 | Listed for rent | $1,225-5.8%$1/sqft |
Source: Zillow Rentals Report a problem | ||
| 2/3/2026 | Listing removed | $1,300$1/sqft |
Source: GSREIN #2527504 Report a problem | ||
| 12/1/2025 | Price change | $1,300-7.1%$1/sqft |
Source: GSREIN #2527504 Report a problem | ||
| 10/21/2025 | Listed for rent | $1,400+12%$1/sqft |
Source: GSREIN #2527504 Report a problem | ||
| 8/21/2023 | Listing removed | -- |
Source: GSREIN #2405686 Report a problem | ||
| 7/25/2023 | Listed for rent | $1,250$1/sqft |
Source: GSREIN #2405686 Report a problem | ||
| 12/29/2019 | Listing removed | $155,000$66/sqft |
Source: The Investment House #2202077 Report a problem | ||
| 5/2/2019 | Listed for sale | $155,000$66/sqft |
Source: The Investment House #2202077 Report a problem | ||
| 10/15/2008 | Sold | -- |
Source: Public Record Report a problem | ||
Public tax history
| Year | Property taxes | Tax assessment |
|---|---|---|
| 2026 | $2,006 | $15,200 |
| 2025 | $2,006 -1.5% | $15,200 |
| 2024 | $2,037 +5.3% | $15,200 +14.5% |
| 2023 | $1,935 +7.5% | $13,280 +3.8% |
| 2022 | $1,800 -5.9% | $12,790 -3.7% |
| 2021 | $1,912 | $13,280 |
| 2020 | -- | $13,280 +33.5% |
| 2019 | $1,503 | $9,950 |
| 2018 | $1,503 | $9,950 -28.4% |
| 2017 | $1,503 -1.9% | $13,900 |
| 2016 | $1,533 -27.3% | $13,900 |
| 2015 | $2,110 | $13,900 |
| 2014 | $2,110 +2.1% | $13,900 |
| 2013 | $2,067 | $13,900 +509.6% |
| 2012 | -- | $2,280 +26.7% |
| 2011 | -- | $1,800 |
| 2010 | -- | $1,800 |
| 2009 | -- | $1,800 |
| 2007 | -- | $1,800 -70% |
| 2006 | -- | $6,000 |
| 2004 | -- | $6,000 |
| 2002 | -- | $6,000 |
| 2001 | -- | $6,000 |
| 2000 | -- | $6,000 |
Find assessor info on the county website
Monthly payment
Est. payment
Payment breakdown
Explore the cost of this home by adjusting the details. Changes won't be saved.Climate risks
Neighborhood: Holy Cross



Similar homes
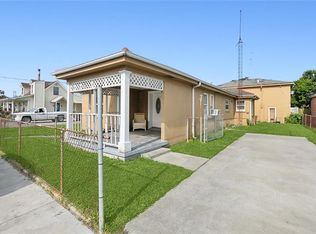
- $325,0005 bd3 ba2.7k sqft2200 Trio St, Chalmette, LA 70043For Sale
 MLS ID #2569807, Richard Miley, 1 Percent Lists Legacy. GSREIN
- $364,0007 bd3 ba2.8k sqft2441-43 Gladiolus St, New Orleans, LA 70122For Sale
 MLS ID #2571857, Amanda Mitternight, Crescent Sotheby's International Realty. GSREIN
- $285,0004 bd2 ba1.9k sqft2019-21 Kerlerec St, New Orleans, LA 70116For Sale
 MLS ID #2576127, Jeffery Puckett, Compass Slidell. GSREIN
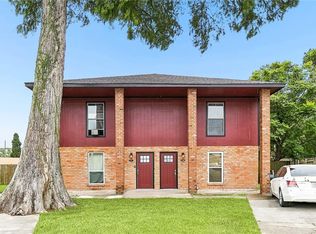
- $252,0006 bd4 ba2.5k sqft7-7A Shepard Ct, New Orleans, LA 70114For Sale
 MLS ID #2563558, Andy Nguyen, Wurth Real Estate Services. GSREIN
- $172,5003 bd2 ba1.2k sqft1221 Lamanche St, New Orleans, LA 70117For SaleMLS ID #2570038, Edward Shedlock, FQR Realtors. GSREIN
- $249,0008 bd2 ba1.8k sqft1639-41 N Villere St, New Orleans, LA 70116For SaleMLS ID #2574887, Richard Hebert, Crescent Sotheby's International Realty. GSREIN
- $190,0005 bd2 ba1.6k sqft2404-06 New Orleans St, New Orleans, LA 70119For SaleMLS ID #2581249, Phillip Lobman, Keller Williams Realty New Orleans. GSREIN
- $239,9005 bd2 ba2k sqft3625-27 Shangri La Dr, Chalmette, LA 70043For SaleMLS ID #2569761, Richard Miley, 1 Percent Lists Legacy. GSREIN
- $269,0004 bd3 ba2.1k sqft5700 Albany Ct, New Orleans, LA 70131For SaleMLS ID #2580198, Arnold Yoo, Engel & Völkers New Orleans. GSREIN
- $250,0006 bd3 ba2.1k sqft313 Oak Ave, New Orleans, LA 70123For SaleMLS ID #2580255, Tangie Stephens, KELLER WILLIAMS REALTY 455-0100. GSREIN
- $460,0006 bd4 ba3.3k sqft5510 Canal Blvd, New Orleans, LA 70124For SaleMLS ID #2556359, Samara Poche', Compass Historic (LATT09). GSREIN
- $189,0003 bd2 ba1.6k sqft1613 Clouet St, New Orleans, LA 70117For SaleMLS ID #2554806, Erica Williams, Keller Williams Realty New Orleans. GSREIN
- $299,0004 bd3 ba2.3k sqft2700 Sandero Del Este St, Harvey, LA 70058For SaleMLS ID #2535684, Hilmi Judeh, Homesmart Realty South. GSREIN
- $214,9005 bd2 ba1.6k sqft6230-6232 Eads St, New Orleans, LA 70122For SaleMLS ID #2576068, Ashton Brumfield, La Maison Luxe Realty Group LLC. GSREIN
- $450,0005 bd3 ba2.3k sqft228-30 22nd St, New Orleans, LA 70124For SaleMLS ID #2559544, Shannon Nash, RE/MAX Affiliates. GSREIN
- $309,9993 bd2 ba1.7k sqft200 Houma Blvd, Metairie, LA 70001For SaleMLS ID #2568766, Nicole Waguespack, NOLA Living Realty. GSREIN
- $235,0003 bd3 ba2.1k sqft2201 Amelia St, New Orleans, LA 70115For SaleMLS ID #2569618, Guyon Lewis, Keller Williams Realty New Orleans. GSREIN
- $275,0004 bd2 ba1.8k sqft5030 Touro St, New Orleans, LA 70122For SaleMLS ID #2554293, Joseph Lorenzo, Supreme Management, LLC. GSREIN
- $210,0004 bd3 ba1.9k sqft1945 Mediamolle Dr, New Orleans, LA 70114For SaleMLS ID #2572437, T Jones, TJones & Co, LLC. GSREIN
- $190,0004 bd2 ba1.5k sqft1418-24 Behrman Ave, New Orleans, LA 70114For SaleMLS ID #2580285, Guyon Lewis, Keller Williams Realty New Orleans. GSREIN
