$274,800
3 bd|1 ba|1.2k sqft
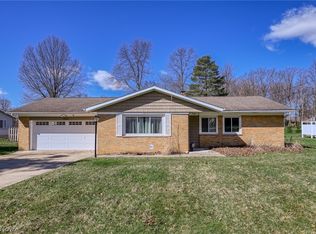
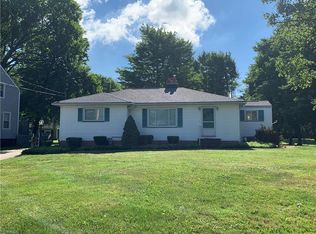
7479 Som Center Rd, Solon, OH 44139
Off Market
Zillow last checked: 7 hours ago
Listing updated: March 05, 2026 at 05:09am
Nanci L Crystal 216-347-9492 nancicrystal@howardhanna.com,
Howard Hanna
Not available
Estimated sales range
Not available
Not available
| Date | Event | Price |
|---|---|---|
| 3/4/2026 | Pending sale | $295,000 |
Source: MLS Now #5190675 Report a problem | ||
| 3/4/2026 | Listed for sale | $295,000 |
Source: MLS Now #5190675 Report a problem | ||
| 3/2/2026 | Listing removed | $295,000 |
Source: MLS Now #5147255 Report a problem | ||
| 12/2/2025 | Price change | $295,000-1.7% |
Source: MLS Now #5147255 Report a problem | ||
| 10/13/2025 | Listed for sale | $300,000 |
Source: MLS Now #5147255 Report a problem | ||
| 9/29/2025 | Contingent | $300,000 |
Source: MLS Now #5147255 Report a problem | ||
| 8/11/2025 | Listed for sale | $300,000+18.2% |
Source: MLS Now #5147255 Report a problem | ||
| 4/16/2025 | Sold | $253,725-7.7% |
Source: MLS Now #5111980 Report a problem | ||
| 4/9/2025 | Pending sale | $274,900 |
Source: MLS Now #5111980 Report a problem | ||
| 4/4/2025 | Listed for sale | $274,900+118.2% |
Source: MLS Now #5111980 Report a problem | ||
| 10/13/2011 | Sold | $126,000-9% |
Source: MLS Now #3257414 Report a problem | ||
| 9/10/2011 | Pending sale | $138,500 |
Source: RE/MAX Haven Realty #3257414 Report a problem | ||
| 8/27/2011 | Listed for sale | $138,500+1837.1% |
Source: RE/MAX HAVEN REALTY #3257414 Report a problem | ||
| 12/11/2000 | Sold | $7,150 |
Source: Public Record Report a problem | ||
| Year | Property taxes | Tax assessment |
|---|---|---|
| 2024 | $4,042 +7.5% | $73,850 +31.4% |
| 2023 | $3,762 +0.2% | $56,210 |
| 2022 | $3,753 +1.2% | $56,210 |
| 2021 | $3,711 +7.9% | $56,210 +18% |
| 2020 | $3,438 +1% | $47,640 |
| 2019 | $3,404 +14.2% | $47,640 |
| 2018 | $2,981 -2.5% | $47,640 +3.1% |
| 2017 | $3,059 +1% | $46,210 |
| 2016 | $3,029 | $46,210 |
| 2015 | $3,029 +1.5% | $46,210 +8% |
| 2014 | $2,984 +1.4% | $42,780 |
| 2013 | $2,942 +3.3% | $42,780 |
| 2012 | $2,848 +2.2% | $42,780 -2.5% |
| 2011 | $2,787 0% | $43,860 |
| 2010 | $2,787 +0.8% | $43,860 |
| 2009 | $2,765 -0.6% | $43,860 -4% |
| 2008 | $2,781 +2.3% | $45,680 |
| 2007 | $2,719 +0.1% | $45,680 |
| 2006 | $2,716 +7.1% | $45,680 +14.2% |
| 2005 | $2,536 +9.1% | $40,010 |
| 2004 | $2,325 +15.1% | $40,010 |
| 2003 | $2,019 +4.2% | $40,010 +7% |
| 2002 | $1,937 -42.6% | $37,380 |
| 2001 | $3,372 +8.2% | $37,380 |
| 2000 | $3,118 | $37,380 |
Find assessor info on the county website
Source: MLS Now. This data may not be complete. We recommend contacting the local school district to confirm school assignments for this home.