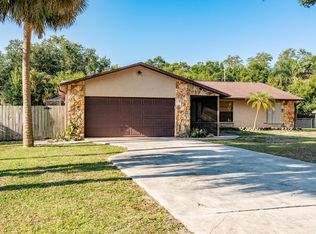
This 2016 square foot single family home has 4 bedrooms and 3.0 bathrooms. This home is located at 7503 Salerno Rd, Fort Pierce, FL 34951.
Pre-foreclosure
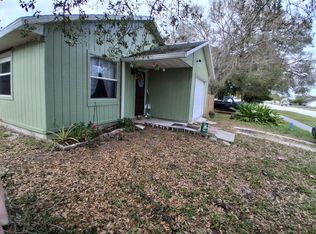
Street View
Est. $265,200
7503 Salerno Rd, Fort Pierce, FL 34951
4beds
2,016sqft
SingleFamily
Built in 1972
0.41 Acres Lot
$-- Zestimate®
$132/sqft
$75/mo HOA
Overview
- 231 days |
- 81 |
- 6 |
Facts & features
Interior
Bedrooms & bathrooms
- Bedrooms: 4
- Bathrooms: 3
- Full bathrooms: 2
- 1/2 bathrooms: 1
Heating
- Forced air
Cooling
- Central
Appliances
- Included: Dishwasher, Microwave, Range / Oven, Refrigerator
Features
- Stack Bedrooms
- Flooring: Tile
- Basement: None
Interior area
- Total interior livable area: 2,016 sqft
Property
Parking
- Total spaces: 5
- Parking features: Garage - Detached
Features
- Exterior features: Stucco, Cement / Concrete
Lot
- Size: 0.41 Acres
Details
- Parcel number: 130160602520008
Construction
Type & style
- Home type: SingleFamily
Materials
- Foundation: Concrete
- Roof: Shake / Shingle
Condition
- Year built: 1972
Utilities & green energy
- Utilities for property: Septic, Well Water
Community & HOA
HOA
- Has HOA: Yes
- HOA fee: $75 monthly
Location
- Region: Fort Pierce
Financial & listing details
- Price per square foot: $132/sqft
- Tax assessed value: $265,200
- Annual tax amount: $2,662
Visit our professional directory to find a foreclosure specialist in your area that can help with your home search.
Find a foreclosure agentForeclosure details
Estimated market value
Not available
Estimated sales range
Not available
$2,878/mo
Price history
Price history
| Date | Event | Price |
|---|---|---|
| 2/27/2026 | Listing removed | $389,900$193/sqft |
Source: | ||
| 11/18/2025 | Price change | $389,900-13.3%$193/sqft |
Source: | ||
| 3/10/2025 | Listed for sale | $449,900+20%$223/sqft |
Source: | ||
| 4/5/2024 | Listing removed | -- |
Source: | ||
| 11/9/2023 | Price change | $374,900-6.3%$186/sqft |
Source: | ||
| 9/30/2023 | Listed for sale | $399,900+95.1%$198/sqft |
Source: | ||
| 9/24/2018 | Sold | $205,000$102/sqft |
Source: | ||
| 7/10/2018 | Listed for sale | $205,000+173.3%$102/sqft |
Source: Tubeck Realty Inc #RX-10446470 Report a problem | ||
| 5/20/2011 | Sold | $75,000-4.9%$37/sqft |
Source: Public Record Report a problem | ||
| 4/7/2011 | Price change | $78,900-6%$39/sqft |
Source: Prudential Florida Realty #R3179615 Report a problem | ||
| 3/4/2011 | Listed for sale | $83,900-58.5%$42/sqft |
Source: Prudential Florida Realty #R3179615 Report a problem | ||
| 9/21/2005 | Sold | $202,000+7980%$100/sqft |
Source: Public Record Report a problem | ||
| 2/16/2001 | Sold | $2,500$1/sqft |
Source: Public Record Report a problem | ||
Public tax history
Public tax history
| Year | Property taxes | Tax assessment |
|---|---|---|
| 2024 | $2,662 +2.3% | $159,665 +3% |
| 2023 | $2,601 +7.2% | $155,015 +3% |
| 2022 | $2,426 +0.3% | $150,500 +3% |
| 2021 | $2,419 +0.6% | $146,117 +1.4% |
| 2020 | $2,404 | $144,100 -0.1% |
| 2019 | $2,404 -27.1% | $144,300 +5.2% |
| 2018 | $3,296 +10% | $137,200 +45.3% |
| 2017 | $2,997 +150.8% | $94,400 -3.9% |
| 2016 | $1,195 +3% | $98,200 +14.2% |
| 2015 | $1,160 -1.2% | $86,000 +30.5% |
| 2014 | $1,174 | $65,900 +0.9% |
| 2013 | -- | $65,300 -1.1% |
| 2012 | -- | $66,000 -7.2% |
| 2011 | -- | $71,100 -9.1% |
| 2010 | -- | $78,200 -4% |
| 2009 | -- | $81,500 -32% |
| 2008 | -- | $119,800 -24.7% |
| 2007 | -- | $159,100 -4.2% |
| 2006 | -- | $166,000 +54.3% |
| 2005 | -- | $107,558 +25.6% |
| 2004 | -- | $85,633 |
| 2003 | -- | -- |
| 2002 | -- | -- |
| 2001 | -- | -- |
| 2000 | -- | -- |
Find assessor info on the county website
Monthly payment
Estimated monthly payment
All calculations are estimates and provided by Zillow, Inc. for informational purposes only. Actual amounts may vary.
HOA fees may include property taxes on listings classified as Co-Ops. Contact the listing agent and/or owner for fee details.
Mortgage interest rates are dependent on a number of factors, including credit score, down payment, and repayment length. Interest rate data provided by Zillow Group Marketplace, Inc. as of 1/1/1970 from various mortgage lenders with which we have lead or other similar arrangements; the Estimated Payment is an average of those rates.
See how much you could borrow to make a competitive offer.
Climate risks
Neighborhood: Lakewood Park
Nearby schools
GreatSchools rating
- 6/10Lakewood Park Elementary SchoolGrades: PK-5Distance: 1.8 mi
- 5/10Dan Mccarty SchoolGrades: 6-8Distance: 9 mi
- 3/10Fort Pierce Westwood High SchoolGrades: 9-12Distance: 6.4 mi


- Florida
- Saint Lucie County
- Fort Pierce
- 34951
- Lakewood Park
- 7503 Salerno Rd
Nearby cities
Nearby neighborhoods
Nearby zip codes
Other Fort Pierce Topics
