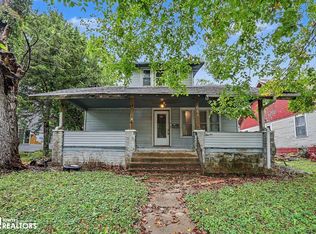
Fantastic Investment Opportunity! This 3-bedroom, 2-bath home offers tremendous potential for investors, landlords, or buyers looking for their next fixer-upper project. The owners are actively cleaning up the property, making it easier to envision the possibilities. With solid potential and room to add value, this property is being sold AS IS and priced accordingly. Please note that the washer and refrigerator will not remain with the home. Don't miss this chance to transform this property into a profitable investment or your dream renovation project!
Active
$47,000
517 Frank St, Ottumwa, IA 52501
3beds
1,428sqft
Single Family Residence
Built in 1920
0.29 Acres Lot
$-- Zestimate®
$33/sqft
$-- HOA
What's special
- 3 days
- 260
- 4
Likely to sell faster than
Zillow last checked:
Listing updated:
Listed by:
Erin Hoselton 641-455-8664,
Bridge City Realty
Source: NoCoast MLS as distributed by MLS GRID,MLS#: 6343871
Facts & features
Interior
Bedrooms & bathrooms
- Bedrooms: 3
- Bathrooms: 2
- Full bathrooms: 2
Heating
- Forced Air
Cooling
- Central Air
Features
- Basement: Full
Interior area
- Total interior livable area: 1,428 sqft
Property
Parking
- Total spaces: 1
- Parking features: Gravel
- Garage spaces: 1
Accessibility
- Accessibility features: None
Features
- Levels: Two
Lot
- Size: 0.29 Acres
- Dimensions: 12,600
Details
- Parcel number: 007414240001000
Construction
Type & style
- Home type: SingleFamily
- Property subtype: Single Family Residence
Materials
- Wood Siding
Condition
- Year built: 1920
Utilities & green energy
- Sewer: Public Sewer
- Water: Public
Community & HOA
HOA
- Has HOA: No
Location
- Region: Ottumwa
Financial & listing details
- Price per square foot: $33/sqft
- Tax assessed value: $74,360
- Annual tax amount: $1,568
- Date on market: 10/21/2026
- Cumulative days on market: 4 days
Estimated market value
Not available
Estimated sales range
Not available
Not available
Price history
| Date | Event | Price |
|---|---|---|
| 10/21/2026 | Listed for sale | $47,000-35.2%$33/sqft |
Source:  NoCoast MLS as distributed by MLS GRID #6343871 Report a problem | ||
| 2/19/2023 | Listing removed | -- |
Source: NoCoast MLS as distributed by MLS GRID #5626692 Report a problem | ||
| 5/19/2022 | Listing removed | $72,500+2.8%$51/sqft |
Source: NoCoast MLS as distributed by MLS GRID #5626692 Report a problem | ||
| 2/18/2021 | Sold | $70,500-2.8%$49/sqft |
Source: NoCoast MLS as distributed by MLS GRID #5626692 Report a problem | ||
| 1/11/2021 | Pending sale | $72,500$51/sqft |
Source: NoCoast MLS as distributed by MLS GRID #5626692 Report a problem | ||
| 12/3/2020 | Price change | $72,500-0.7%$51/sqft |
Source: Bridge City Realty #5626692 Report a problem | ||
| 11/12/2020 | Price change | $73,000-0.7%$51/sqft |
Source: Bridge City Realty #5626692 Report a problem | ||
| 10/19/2020 | Price change | $73,500-0.7%$51/sqft |
Source: Bridge City Realty #5626692 Report a problem | ||
| 9/28/2020 | Price change | $74,000-0.7%$52/sqft |
Source: Bridge City Realty #5626692 Report a problem | ||
| 9/18/2020 | Price change | $74,500-0.7%$52/sqft |
Source: Bridge City Realty #5626692 Report a problem | ||
| 8/7/2020 | Price change | $75,000-6.1%$53/sqft |
Source: Bridge City Realty #5626692 Report a problem | ||
| 7/20/2020 | Listed for sale | $79,900$56/sqft |
Source: Bridge City Realty #5626692 Report a problem | ||
Public tax history
| Year | Property taxes | Tax assessment |
|---|---|---|
| 2025 | $1,294 +5.7% | $74,360 +6.3% |
| 2024 | $1,224 +8.3% | $69,940 |
| 2023 | $1,130 +20.5% | $69,940 +24.4% |
| 2022 | $938 +6.6% | $56,210 +15.9% |
| 2021 | $880 +44.3% | $48,510 +12.3% |
| 2020 | $610 +355.2% | $43,200 |
| 2019 | $134 +8.1% | $43,200 |
| 2018 | $124 +24% | $43,200 |
| 2017 | $100 -18% | $43,200 -3.8% |
| 2016 | $122 -85.2% | $44,900 |
| 2015 | $822 | $44,900 |
| 2014 | $822 +8.4% | $44,900 |
| 2013 | $758 -1.6% | -- |
| 2012 | $770 +0.8% | -- |
| 2011 | $764 +17.5% | -- |
| 2010 | $650 +14.4% | -- |
| 2009 | $568 +4.4% | -- |
| 2008 | $544 +7.9% | -- |
| 2007 | $504 +15.6% | -- |
| 2005 | $436 | -- |
Find assessor info on the county website
Monthly payment
Est. payment
Payment breakdown
Explore the cost of this home by adjusting the details. Changes won't be saved.Climate risks
Neighborhood: 52501

Similar homes
- $55,0004 bd1 ba1.3k sqft719 Albany St, Ottumwa, IA 52501Active
 MLS ID #6343676, Lonnie D Lunsford, Team Real Estate. NoCoast MLS as distributed by MLS GRID
- $39,9004 bd1 ba2k sqft1011 W 2nd St, Ottumwa, IA 52501Active
 MLS ID #6343675, Curt Hopkins, Century 21 Signature Real Estate (M). NoCoast MLS as distributed by MLS GRID
- $55,0002 bd1 ba1.1k sqft515 & 507 Summit St, Ottumwa, IA 52501Active
 MLS ID #6342163, Kevin K Veatch, Ottumwa Realty. NoCoast MLS as distributed by MLS GRID
- $55,0003 bd1 ba1.4k sqft114 S Van Buren Ave, Ottumwa, IA 52501Active
 MLS ID #6343598, Katlyn Overturf, RE/MAX Pride Ottumwa. NoCoast MLS as distributed by MLS GRID
