WOW! Tranquil 3/2/2 Saltwater POOL heated massive Lanai in South Venice. Close to Beach Wonderful great room with cathedral ceilings and skylights that brighten up the room.New Roof 2022 with transferable warranty , New A/c 2022 French doors leading out to the VERY large lanai/ pool area. Perfect for entertaining. Outdoor area also has an extended parking area, fenced for RV, Boat or any other Toys. This home has been beautifully maintained . Ceramic tile floors . Kitchen updated and all appliances replaced in 2025. all these updates and many more. You want to wait to see this Fantastic home. 2 Car Extraa Large Garage minutes away from beautiful beaches, golf, fishing, restaurants and many other of the amazing things Venice has to offer. Schedule your showing today! 2% Buyers Agent or 2 % off Price
For sale by owner
Price cut: $6K (11/4)
$419,000
770 Hobart Rd, Venice, FL 34293
3beds
1,350sqft
SingleFamily
Built in 1989
10,000 Square Feet Lot
$-- Zestimate®
$310/sqft
$-- HOA
What's special
Saltwater pool heatedMassive lanaiCeramic tile floors
What the owner loves about this home
Location Location Great Pool and Outdoor sitting Rain or Shine
- 56 days
- 521
- 50
Listed by:
Property Owner (941) 236-0752
Facts & features
Interior
Bedrooms & bathrooms
- Bedrooms: 3
- Bathrooms: 2
- Full bathrooms: 2
Heating
- Forced air, Other, Other
Cooling
- Central
Appliances
- Included: Dishwasher, Dryer, Garbage disposal, Microwave, Range / Oven, Refrigerator, Washer
Features
- Flooring: Tile
Interior area
- Total interior livable area: 1,350 sqft
Property
Parking
- Parking features: Garage - Attached, Off-street
Features
- Exterior features: Stucco
Lot
- Size: 10,000 Square Feet
Details
- Parcel number: 0472020001
Construction
Type & style
- Home type: SingleFamily
Materials
- masonry
- Foundation: Concrete
- Roof: Asphalt
Condition
- New construction: No
- Year built: 1989
Community & HOA
Location
- Region: Venice
Financial & listing details
- Price per square foot: $310/sqft
- Tax assessed value: $309,400
- Annual tax amount: $3,073
- Date on market: 9/16/2026
Estimated market value
Not available
Estimated sales range
Not available
$2,876/mo
Price history
| Date | Event | Price |
|---|---|---|
| 11/4/2026 | Price change | $419,000-1.4%$310/sqft |
Source: Owner Report a problem | ||
| 10/17/2026 | Price change | $425,000-2.3%$315/sqft |
Source: Owner Report a problem | ||
| 9/27/2026 | Price change | $435,000-3.1%$322/sqft |
Source: Owner Report a problem | ||
| 9/16/2026 | Listed for sale | $449,000$333/sqft |
Source: Owner Report a problem | ||
| 8/6/2026 | Listing removed | -- |
Source: Owner Report a problem | ||
| 5/18/2026 | Price change | $449,000-6.3%$333/sqft |
Source: Owner Report a problem | ||
| 5/6/2026 | Listed for sale | $479,000+11.7%$355/sqft |
Source: Owner Report a problem | ||
| 1/30/2026 | Listing removed | -- |
Source: Owner Report a problem | ||
| 1/26/2026 | Price change | $429,000-4.5%$318/sqft |
Source: Owner Report a problem | ||
| 12/26/2025 | Listed for sale | $449,000$333/sqft |
Source: Owner Report a problem | ||
| 12/15/2025 | Listing removed | -- |
Source: Owner Report a problem | ||
| 11/26/2025 | Listed for sale | $449,000$333/sqft |
Source: Owner Report a problem | ||
| 11/4/2025 | Listing removed | -- |
Source: Owner Report a problem | ||
| 10/14/2025 | Listed for sale | $449,000+12.5%$333/sqft |
Source: Owner Report a problem | ||
| 9/28/2025 | Listing removed | -- |
Source: Owner Report a problem | ||
| 8/23/2025 | Price change | $399,000-4.8%$296/sqft |
Source: Owner Report a problem | ||
| 7/12/2025 | Price change | $419,000-3.7%$310/sqft |
Source: Owner Report a problem | ||
| 7/8/2025 | Price change | $435,000-3.1%$322/sqft |
Source: Owner Report a problem | ||
| 6/24/2025 | Price change | $449,000-2.2%$333/sqft |
Source: Owner Report a problem | ||
| 4/27/2025 | Listed for sale | $459,000$340/sqft |
Source: Owner Report a problem | ||
| 3/7/2025 | Listing removed | -- |
Source: Owner Report a problem | ||
| 12/6/2024 | Listed for sale | $459,000$340/sqft |
Source: Owner Report a problem | ||
| 11/16/2024 | Listing removed | -- |
Source: Owner Report a problem | ||
| 10/21/2024 | Price change | $459,000-2.1%$340/sqft |
Source: Owner Report a problem | ||
| 7/15/2024 | Listed for sale | $469,000+80.5%$347/sqft |
Source: Owner Report a problem | ||
| 7/10/2019 | Sold | $259,900+6.1%$193/sqft |
Source: Public Record Report a problem | ||
| 4/20/2017 | Sold | $245,000+63.3%$181/sqft |
Source: Public Record Report a problem | ||
| 2/1/2013 | Sold | $150,000-48.8%$111/sqft |
Source: Public Record Report a problem | ||
| 2/5/2007 | Sold | $293,000+143.2%$217/sqft |
Source: Public Record Report a problem | ||
| 6/25/2001 | Sold | $120,500$89/sqft |
Source: Public Record Report a problem | ||
Public tax history
| Year | Property taxes | Tax assessment |
|---|---|---|
| 2025 | $3,073 +3.4% | $252,515 +2.9% |
| 2024 | $2,973 +4.3% | $245,398 +3% |
| 2023 | $2,849 +8.1% | $238,250 +10.4% |
| 2022 | $2,637 +1.1% | $215,777 +3% |
| 2021 | $2,608 +0.3% | $209,492 +1.4% |
| 2020 | $2,599 -12.4% | $206,600 +2.3% |
| 2019 | $2,967 | $201,900 +7.3% |
| 2018 | $2,967 +7.5% | $188,200 +20.4% |
| 2017 | $2,759 +28.5% | $156,332 +7.7% |
| 2016 | $2,147 -6.5% | $145,100 +12.3% |
| 2015 | $2,296 +0.6% | $129,200 +9.4% |
| 2014 | $2,283 +9.8% | $118,100 |
| 2013 | $2,080 +21.3% | $118,100 +28% |
| 2012 | $1,714 -4.9% | $92,300 -8.3% |
| 2011 | $1,803 -9.5% | $100,600 -9.9% |
| 2010 | $1,993 -17.9% | $111,600 -9.4% |
| 2009 | $2,429 | $123,200 -20.2% |
| 2008 | $2,429 +53.5% | $154,400 +34.7% |
| 2007 | $1,582 | $114,603 +2.5% |
| 2006 | -- | $111,808 +3% |
| 2005 | -- | $108,551 +3% |
| 2004 | $1,612 -3.8% | $105,389 +1.9% |
| 2003 | $1,675 -0.3% | $103,424 +2.4% |
| 2002 | $1,681 +28.9% | $101,000 +25.3% |
| 2001 | $1,304 +3.9% | $80,600 +3% |
| 2000 | $1,255 | $78,252 |
Find assessor info on the county website
Monthly payment
Est. payment
Payment breakdown
Explore the cost of this home by adjusting the details. Changes won't be saved.Climate risks
Neighborhood: 34293

Similar homes
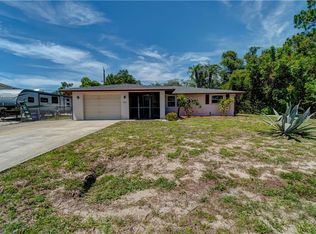
- $410,0003 bd2 ba1.8k sqft755 KENT ROAD, VENICE, FL 34293For Sale
 MLS ID #O6343728, Steven Koleno, BEYCOME OF FLORIDA LLC. Stellar MLS
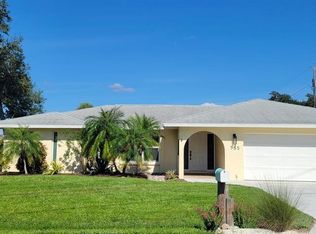
- $399,0002 bd2 ba1.1k sqft1148 ROYAL ROAD, VENICE, FL 34293For Sale
 MLS ID #A4708295, Dirk Stroh, FLORIDA HOMES OF YOUR DREAMS. Stellar MLS
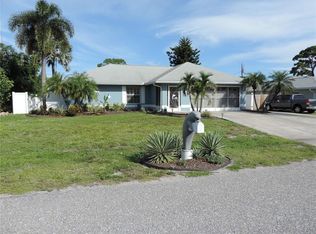
- $365,0003 bd3 ba1.2k sqft1159 FUNDY ROAD, VENICE, FL 34293For Sale
 MLS ID #O6396790, Yorky Corcho, LA ROSA REALTY CW PROPERTIES L. Stellar MLS
- $349,0003 bd2 ba1.8k sqft4398 SUMMERTREE ROAD, VENICE, FL 34293For Sale
 MLS ID #A4706070, Moe Mossa, SAVVY AVENUE, LLC. Stellar MLS
- $429,9903 bd2 ba1.6k sqft19763 TORTUGA CAY DRIVE, VENICE, FL 34293For SaleMLS ID #A4706096, Justine Hoo, WILLS REAL ESTATE LLC. Stellar MLS
- $474,9003 bd2 ba1.8k sqft20259 CONCERTO PLACE, VENICE, FL 34293For SaleMLS ID #A4710952, Al Grabo, ARCO REALTY GROUP. Stellar MLS
- $312,9002 bd2 ba1.9k sqft20 IDLE SANDS DRIVE, VENICE, FL 34293For SaleMLS ID #A4702808, Thomas Trammell, III, WHITE SANDS REALTY GROUP FL. Stellar MLS
- $279,0002 bd2 ba1k sqft375 TERRAPIN, VENICE, FL 34293For SaleMLS ID #O6414018, Steven Koleno, BEYCOME OF FLORIDA LLC. Stellar MLS
- $386,0003 bd2 ba1.8k sqft26 CLINTWOOD AVENUE, ENGLEWOOD, FL 34223For SaleMLS ID #TB8441937, Dan Lanhaus, DALTON WADE INC. Stellar MLS
- $395,0003 bd2 ba1.7k sqft5533 GULFPORT TERRACE, PORT CHARLOTTE, FL 33981For SaleMLS ID #A4712353, Wendy Keen, REAL BROKER, LLC. Stellar MLS
- $324,0003 bd2 ba1.3k sqft482 PENDLETON PLACE, VENICE, FL 34292For SaleMLS ID #N6139250, Jim Kasmirski, LLC, KAZ REAL ESTATE COMPANY. Stellar MLS
- $349,0002 bd2 ba1.6k sqft318 CLEARBROOK CIRCLE #106, VENICE, FL 34292For SaleMLS ID #N6146539, Sandi Tresh, RE/MAX PALM REALTY OF VENICE. Stellar MLS
- $569,0003 bd2 ba1.7k sqft1720 FOSSIL DRIVE, ENGLEWOOD, FL 34223For SaleMLS ID #R4911073, Chris Phelps, SLOW DOWN MON, LLC. Stellar MLS
- $620,0003 bd2 ba1.3k sqft517 RAVENNA STREET N, NOKOMIS, FL 34275For SaleMLS ID #N6146574, John Sas, EXIT KING REALTY. Stellar MLS
- $499,9002 bd2 ba1.7k sqft9438 CRUGAR TERRACE, ENGLEWOOD, FL 34224For SaleMLS ID #D6149491, Alex Chirillo, RE/MAX ALLIANCE GROUP. Stellar MLS
- $399,0004 bd3 ba1.8k sqft6090 HIDEAWAY PLACE, PORT CHARLOTTE, FL 33981For SaleMLS ID #A4709546, Brett Keyser, Jr, RE/MAX ALLIANCE GROUP. Stellar MLS
- $399,0003 bd2 ba1.8k sqft12 TEE VIEW COURT, ROTONDA WEST, FL 33947For SaleMLS ID #D6148524, Lu Cotta, LU RAMSAY COTTA, REAL ESTATE. Stellar MLS
- $415,0003 bd2 ba1.9k sqft229 LAUREL HOLLOW DRIVE #83, NOKOMIS, FL 34275For SaleMLS ID #A4678836, Glenn Davis, COLDWELL BANKER SARASOTA CENT.. Stellar MLS
- $424,9003 bd3 ba1.6k sqft19891 MIDWAY BOULEVARD, PORT CHARLOTTE, FL 33948For SaleMLS ID #C7527660, Adam Keller, RE/MAX PALM REALTY. Stellar MLS
- $369,9003 bd2 ba1.4k sqft6417 KLAUS COURT, PORT CHARLOTTE, FL 33981For SaleMLS ID #O6430473, Daniel Robinson, HOUWZER INC. Stellar MLS
