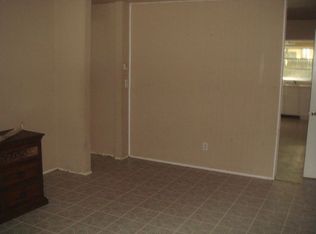
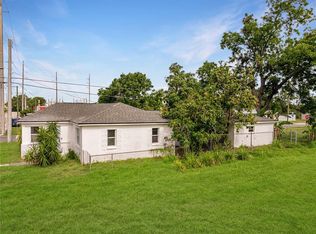
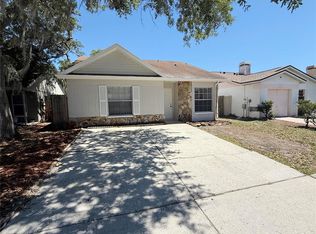
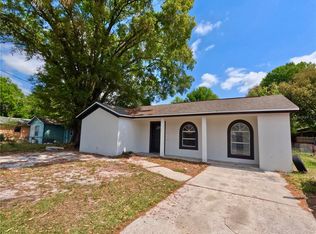
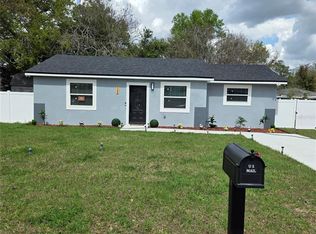
One or more photo(s) has been virtually staged. Welcome to this super cute and updated 3-bedroom, 2-bathroom home in Plant City! Recent updates include a NEW Roof, NEW A/C, NEW tankless water heater, NEW double pane windows, and NEW Electric Panel. Additional updating included a complete brand-new kitchen with shaker cabinets, new appliances, new luxury vinyl flooring and new carpets in bedrooms, freshly painted, new lighting fixtures and ceiling fans, and refreshed bathrooms. Other features include a 12x20 storage shed which would make for a terrific workshop, privacy-fenced backyard with a double gate, a large great room with tiled floors, and an inside laundry room. The terrific location is less than 1 mile to I-4 for an easy commute to Tampa or Orlando, and less than 2 miles to shops and restaurants. This is a Fannie Mae HomePath Property. First Time Buyers complete the HomePath Ready Buyer homeownership course at HomePath online, include certificate for closing cost assistance. Visit HomePath online for more details. Restrictions apply.
Foreclosure
$269,900
803 Valencia Rd, Plant City, FL 33563
3beds
1,264sqft
Single Family Residence
Built in 1953
8,000 Square Feet Lot
$-- Zestimate®
$214/sqft
$-- HOA
What's special
Freshly paintedNew roofNew carpets in bedroomsNew appliancesNew double pane windowsNew electric panelNew tankless water heater
- 4 days |
- 369 |
- 21 |
Zillow last checked:
Listing updated:
Listing Provided by:
Nancy Hadam 813-654-5500,
RE/MAX REALTY UNLIMITED 813-684-0016,
Steven Lavoie 813-684-0016,
RE/MAX REALTY UNLIMITED
Source: Stellar MLS,MLS#: TB8508091 Originating MLS: Suncoast Tampa
Tour with a local agent
Facts & features
Interior
Bedrooms & bathrooms
- Bedrooms: 3
- Bathrooms: 2
- Full bathrooms: 2
Rooms
- Room types: Great Room, Utility Room
Primary bedroom
- Features: Built-in Closet
- Level: First
- Area: 110 Square Feet
- Dimensions: 11x10
Bedroom 2
- Features: Built-in Closet
- Level: First
- Area: 100 Square Feet
- Dimensions: 10x10
Bedroom 3
- Features: Built-in Closet
- Level: First
- Area: 100 Square Feet
- Dimensions: 10x10
Dining room
- Level: First
- Area: 154 Square Feet
- Dimensions: 14x11
Great room
- Level: First
- Area: 320 Square Feet
- Dimensions: 20x16
Kitchen
- Level: First
- Area: 90 Square Feet
- Dimensions: 10x9
Heating
- Central, Heat Pump
Cooling
- Central Air
Appliances
- Included: Disposal, Microwave, Range
- Laundry: Laundry Room
Features
- Ceiling Fan(s)
- Flooring: Carpet, Ceramic Tile, Luxury Vinyl
- Has fireplace: No
Interior area
- Total structure area: 1,532
- Total interior livable area: 1,264 sqft
Video & virtual tour
Property
Parking
- Total spaces: 1
- Parking features: Driveway
- Carport spaces: 1
- Has uncovered spaces: Yes
Features
- Levels: One
- Stories: 1
- Exterior features: Private Yard, Storage
- Fencing: Fenced,Wood
Lot
- Size: 8,000 Square Feet
- Dimensions: 80 x 100
- Residential vegetation: Oak Trees
Details
- Additional structures: Shed(s), Storage, Workshop
- Parcel number: P2028225AV00000400002.0
- Zoning: R-1
- Special conditions: Real Estate Owned
Construction
Type & style
- Home type: SingleFamily
- Architectural style: Ranch
- Property subtype: Single Family Residence
Materials
- Vinyl Siding, Wood Frame
- Foundation: Slab
- Roof: Other,Shingle
Condition
- New construction: No
- Year built: 1953
Utilities & green energy
- Sewer: Public Sewer
- Water: Public
- Utilities for property: Public
Community & HOA
Community
- Pet fee: $0 monthly
- Subdivision: ORANGE COURT SUB
HOA
- Has HOA: No
Location
- Region: Plant City
Financial & listing details
- Price per square foot: $214/sqft
- Tax assessed value: $133,796
- Annual tax amount: $2,444
- Date on market: 5/13/2026
- Cumulative days on market: 3 days
- Listing terms: Cash,Conventional,FHA,VA Loan
- Ownership: Fee Simple
- Total actual rent: 0
- Road surface type: Paved, Asphalt
Foreclosure details
Estimated market value
Not available
Estimated sales range
Not available
$1,954/mo
Price history
| Date | Event | Price |
|---|---|---|
| 2/3/2020 | Listing removed | $139,999$111/sqft |
Source: WEST COAST REAL ESTATE #T3213024 Report a problem | ||
| 12/17/2019 | Price change | $139,999+3.7%$111/sqft |
Source: WEST COAST REAL ESTATE #T3213024 Report a problem | ||
| 12/11/2019 | Price change | $134,9990%$107/sqft |
Source: WEST COAST REAL ESTATE #T3213024 Report a problem | ||
| 12/1/2019 | Listed for sale | $135,000+22.7%$107/sqft |
Source: WEST COAST REAL ESTATE #T3213024 Report a problem | ||
| 8/17/2016 | Sold | $110,000+0.9%$87/sqft |
Source: Public Record Report a problem | ||
| 6/14/2016 | Listed for sale | $109,000-24.8%$86/sqft |
Source: Owner Report a problem | ||
| 3/25/2016 | Listing removed | $145,000$115/sqft |
Source: Owner Report a problem | ||
| 2/21/2016 | Listed for sale | $145,000+1350%$115/sqft |
Source: Owner Report a problem | ||
| 7/18/2007 | Sold | $10,000$8/sqft |
Source: Public Record Report a problem | ||
Public tax history
| Year | Property taxes | Tax assessment |
|---|---|---|
| 2024 | $788 +5.5% | $92,368 +3% |
| 2023 | $747 -5% | $89,678 +3% |
| 2022 | $787 +2.9% | $87,066 +3% |
| 2021 | $764 +1.8% | $84,530 +1.4% |
| 2020 | $751 +3.4% | $83,363 +2.3% |
| 2019 | $726 | $81,489 +1.9% |
| 2018 | $726 +1.6% | $79,970 +20.1% |
| 2017 | $714 -43.6% | $66,598 +69.3% |
| 2016 | $1,266 +380.8% | $39,347 +6.8% |
| 2015 | $263 +20.8% | $36,857 +0.8% |
| 2014 | $218 | $36,564 -3.5% |
| 2013 | $218 +17% | $37,894 +9.6% |
| 2012 | $186 -26% | $34,574 -8.8% |
| 2011 | $252 -42.4% | $37,913 -20.2% |
| 2010 | $437 -21.2% | $47,539 -19% |
| 2009 | $555 -22.3% | $58,687 -24% |
| 2008 | $714 -21% | $77,243 +5.7% |
| 2007 | $904 -2.3% | $73,090 +4.4% |
| 2006 | $925 +1.9% | $70,040 +3% |
| 2005 | $908 | $68,000 +28.6% |
| 2004 | -- | $52,891 +50.7% |
| 2003 | -- | $35,106 +2.4% |
| 2002 | -- | $34,283 +1.6% |
| 2001 | -- | $33,743 -10.1% |
| 2000 | $163 | $37,553 |
Find assessor info on the county website
Monthly payment
Estimated monthly payment
All calculations are estimates and provided by Zillow, Inc. for informational purposes only. Actual amounts may vary.
HOA fees may include property taxes on listings classified as Co-Ops. Contact the listing agent and/or owner for fee details.
Mortgage interest rates are dependent on a number of factors, including credit score, down payment, and repayment length. Interest rate data provided by Zillow Group Marketplace, Inc. as of 1/1/1970 from various mortgage lenders with which we have lead or other similar arrangements; the Estimated Payment is an average of those rates.
See how much you could borrow to make a competitive offer.
Climate risks
Neighborhood: 33563
Nearby schools
GreatSchools rating
- 2/10Wilson Elementary SchoolGrades: PK-5Distance: 0.2 mi
- 3/10Tomlin Middle SchoolGrades: 6-8Distance: 1.4 mi
- 5/10Plant City High SchoolGrades: 9-12Distance: 2.7 mi
Schools provided by the listing agent
- Elementary: Wilson Elementary School-HB
- Middle: Tomlin-HB
- High: Plant City-HB
Source: Stellar MLS. This data may not be complete. We recommend contacting the local school district to confirm school assignments for this home.
A local agent can set up tours, give advice and negotiate with sellers.

- Florida
- Hillsborough County
- Plant City
- 33563
- 803 Valencia Rd
Nearby cities
Nearby zip codes
Other Plant City Topics
