This 1068 square foot single family home has 2 bedrooms and 1.0 bathrooms. This home is located at 807 W Risk St, Plant City, FL 33563.
Pre-foreclosure
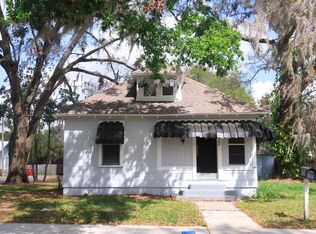
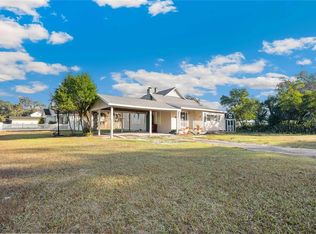
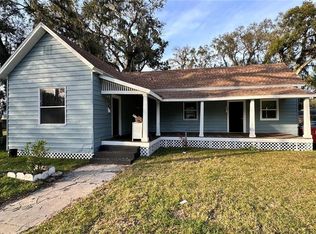
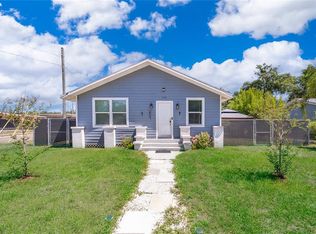
Street View
Est. $278,200
807 W Risk St, Plant City, FL 33563
2beds
1baths
1,068sqft
SingleFamily
Built in 1950
0.47 Acres Lot
$278,200 Zestimate®
$260/sqft
$-- HOA
Overview
- 72 days |
- 9 |
- 0 |
Facts & features
Interior
Bedrooms & bathrooms
- Bedrooms: 2
- Bathrooms: 1
Heating
- Other
Cooling
- Central
Features
- Flooring: Concrete, Hardwood
Interior area
- Total interior livable area: 1,068 sqft
Property
Parking
- Parking features: Carport
Features
- Exterior features: Cement / Concrete
Lot
- Size: 0.47 Acres
Details
- Parcel number: 2228295CP000001000020P
Construction
Type & style
- Home type: SingleFamily
Materials
- masonry
- Roof: Metal
Condition
- Year built: 1950
Community & HOA
Location
- Region: Plant City
Financial & listing details
- Price per square foot: $260/sqft
- Tax assessed value: $202,519
- Annual tax amount: $3,543
Visit our professional directory to find a foreclosure specialist in your area that can help with your home search.
Find a foreclosure agentForeclosure details
Estimated market value
$278,200
$256,000 - $298,000
$1,658/mo
Price history
| Date | Event | Price |
|---|---|---|
| 12/12/2022 | Sold | $227,500$213/sqft |
Source: Public Record Report a problem | ||
Public tax history
| Year | Property taxes | Tax assessment |
|---|---|---|
| 2024 | $3,543 -5.7% | $202,519 -4.9% |
| 2023 | $3,756 +34.1% | $212,862 +56.3% |
| 2022 | $2,801 +15% | $136,145 +10% |
| 2021 | $2,436 +7.9% | $123,768 +10% |
| 2020 | $2,259 +11.9% | $112,516 +10% |
| 2019 | $2,019 | $102,287 -8.6% |
| 2018 | $2,019 +8.1% | $111,889 +31.9% |
| 2017 | $1,869 +16.2% | $84,800 +10.3% |
| 2016 | $1,608 +14.1% | $76,850 +23.3% |
| 2015 | $1,410 +191.5% | $62,305 +20.5% |
| 2014 | $484 | $51,703 +1.5% |
| 2013 | $484 -5.9% | $50,939 -4.7% |
| 2012 | $514 -9.2% | $53,464 -10.7% |
| 2011 | $566 -10.7% | $59,891 -13.9% |
| 2010 | $634 -2.4% | $69,583 -2% |
| 2009 | $650 +1.6% | $70,968 +0.1% |
| 2008 | $640 -22.4% | $70,897 +3% |
| 2007 | $824 -4.8% | $68,832 +2.5% |
| 2006 | $866 +4.4% | $67,153 +4.5% |
| 2005 | $829 | $64,279 +3% |
| 2004 | -- | $62,407 +1.9% |
| 2003 | -- | $61,243 +2.4% |
| 2002 | -- | $59,808 +1.6% |
| 2001 | -- | $58,866 -15.8% |
| 2000 | $724 | $69,882 |
Find assessor info on the county website
Monthly payment
Estimated monthly payment$1,822
All calculations are estimates and provided by Zillow, Inc. for informational purposes only. Actual amounts may vary.
HOA fees may include property taxes on listings classified as Co-Ops. Contact the listing agent and/or owner for fee details.
Mortgage interest rates are dependent on a number of factors, including credit score, down payment, and repayment length. Interest rate data provided by Zillow Group Marketplace, Inc. as of 1/1/1970 from various mortgage lenders with which we have lead or other similar arrangements; the Estimated Payment is an average of those rates.
See how much you could borrow to make a competitive offer.
Climate risks
Neighborhood: 33563
Nearby schools
GreatSchools rating
- 2/10Wilson Elementary SchoolGrades: PK-5Distance: 0.7 mi
- 3/10Tomlin Middle SchoolGrades: 6-8Distance: 1 mi
- 5/10Plant City High SchoolGrades: 9-12Distance: 1.9 mi

- Florida
- Hillsborough County
- Plant City
- 33563
- 807 W Risk St
Nearby cities
Nearby zip codes
Other Plant City Topics
