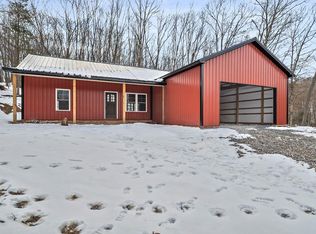
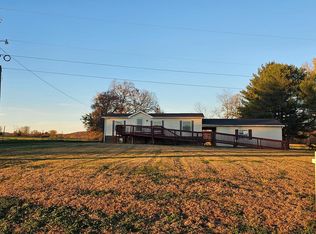
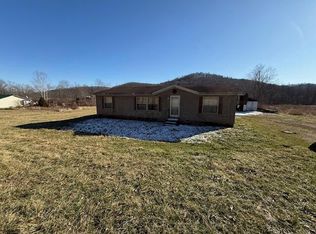
This is a 1392 square foot, 2.0 bathroom, mobile / manufactured home. This home is located at 8096 Denver Rd, Waverly, OH 45690.
Foreclosed
Street View
Est. $126,000
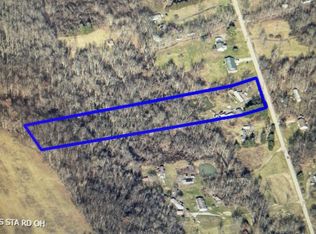
8096 Denver Rd, Waverly, OH 45690
--beds
2baths
1,392sqft
MobileManufactured
Built in 1997
5.89 Acres Lot
$126,000 Zestimate®
$91/sqft
$-- HOA
Overview
- 59 days |
- 35 |
- 1 |
Facts & features
Interior
Bedrooms & bathrooms
- Bathrooms: 2
Heating
- Other
Features
- Flooring: Carpet
Interior area
- Total interior livable area: 1,392 sqft
Property
Parking
- Parking features: Garage - Attached
Features
- Exterior features: Other
Lot
- Size: 5.89 Acres
Details
- Parcel number: 171412232000
Construction
Type & style
- Home type: MobileManufactured
Materials
- Frame
- Roof: Shake / Shingle
Condition
- Year built: 1997
Community & HOA
Location
- Region: Waverly
Financial & listing details
- Price per square foot: $91/sqft
- Tax assessed value: $123,070
- Annual tax amount: $1,552
Visit our professional directory to find a foreclosure specialist in your area that can help with your home search.
Find a foreclosure agentForeclosure details
Estimated market value
$126,000
$92,000 - $165,000
$1,106/mo
Price history
Price history
| Date | Event | Price |
|---|---|---|
| 1/2/2026 | Sold | $55,100-35.2%$40/sqft |
Source: Public Record Report a problem | ||
| 9/9/2020 | Sold | $85,000+123.7%$61/sqft |
Source: Public Record Report a problem | ||
| 1/3/2020 | Sold | $38,000-30.9%$27/sqft |
Source: Public Record Report a problem | ||
| 2/12/2007 | Sold | $55,000-8.3%$40/sqft |
Source: Public Record Report a problem | ||
| 9/29/2006 | Sold | $60,000$43/sqft |
Source: Public Record Report a problem | ||
Public tax history
Public tax history
| Year | Property taxes | Tax assessment |
|---|---|---|
| 2024 | $1,552 -3.1% | $43,070 |
| 2023 | $1,602 +2.2% | $43,070 |
| 2022 | $1,567 +28.6% | $43,070 +36% |
| 2021 | $1,218 -1.7% | $31,670 |
| 2020 | $1,240 -2.3% | $31,670 |
| 2019 | $1,269 +9.1% | $31,670 +11.9% |
| 2018 | $1,163 +1.9% | $28,300 |
| 2017 | $1,141 | $28,300 |
| 2016 | $1,141 -3.4% | $28,300 -4.3% |
| 2015 | $1,182 +6.4% | $29,580 |
| 2014 | $1,111 -0.5% | $29,580 |
| 2013 | $1,117 -9.4% | $29,580 -7.1% |
| 2012 | $1,232 +2.4% | $31,840 |
| 2011 | $1,204 | $31,840 |
| 2010 | $1,204 +2.6% | $31,840 -3.5% |
| 2009 | $1,173 +2.7% | $32,980 |
| 2008 | $1,143 | $32,980 |
| 2007 | $1,143 | $32,980 +24% |
| 2006 | -- | $26,600 |
| 2005 | $1,346 -5.8% | $26,600 |
| 2004 | $1,428 +8.7% | $26,600 +8.5% |
| 2003 | $1,314 +0.8% | $24,520 |
| 2002 | $1,304 | $24,520 |
| 2001 | $1,304 +15.3% | $24,520 +17.2% |
| 2000 | $1,132 | $20,920 |
Find assessor info on the county website
BuyAbility℠ payment
Estimated monthly payment
Boost your down payment with 6% savings match
Earn up to a 6% match & get a competitive APY with a *. Zillow has partnered with to help get you home faster.
Learn more*Terms apply. Match provided by Foyer. Account offered by Pacific West Bank, Member FDIC.Climate risks
Neighborhood: 45690
Nearby schools
GreatSchools rating
- 4/10Huntington Middle SchoolGrades: 5-8Distance: 2.4 mi
- 4/10Huntington High SchoolGrades: 9-12Distance: 2.4 mi
- 3/10Huntington Elementary SchoolGrades: K-4Distance: 2.4 mi