$--
2 bd1 ba725 sqft
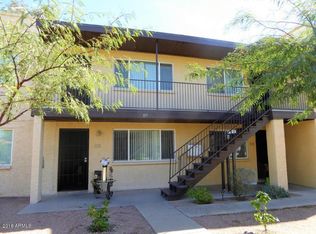
815 W Ray Rd APT 202, Chandler, AZ 85225
Off Market
Zillow last checked:
Listing updated:
Rebecca Hidalgo 602-463-2978,
EveryPlace

Not available
Estimated sales range
Not available
Not available
| Date | Event | Price |
|---|---|---|
| 4/27/2026 | Pending sale | $895,000$269/sqft |
Source: | ||
| 4/25/2026 | Listed for sale | $895,000+81.7%$269/sqft |
Source: | ||
| 6/30/2020 | Sold | $492,500+20.7%$148/sqft |
Source: Public Record Report a problem | ||
| 3/9/2018 | Sold | $408,000-5.1%$123/sqft |
Source: | ||
| 2/7/2018 | Price change | $430,000+7.5%$129/sqft |
Source: West USA Realty #5719241 Report a problem | ||
| 2/5/2018 | Listed for sale | $400,000+135.4%$120/sqft |
Source: West USA Realty #5719241 Report a problem | ||
| 11/18/2014 | Sold | $169,900+62%$51/sqft |
Source: | ||
| 5/18/2011 | Listing removed | $104,900$32/sqft |
Source: foreclosure.com Report a problem | ||
| 2/26/2011 | Pending sale | $104,900$32/sqft |
Source: Fannie Mae #4458641 Report a problem | ||
| 10/24/2010 | Price change | $104,900-8.7%$32/sqft |
Source: SHOWTIME REALTY PROFESSIONALS, LLC #4458641 Report a problem | ||
| 9/15/2010 | Price change | $114,900-47.1%$35/sqft |
Source: SHOWTIME REALTY PROFESSIONALS, LLC #4458641 Report a problem | ||
| 9/11/2010 | Listed for sale | -- |
Source: foreclosure.com Report a problem | ||
| 6/29/2010 | Sold | $217,263+117.5%$65/sqft |
Source: Public Record Report a problem | ||
| 3/27/2010 | Listed for sale | $99,900-61.9%$30/sqft |
Source: REMAX Power Realty #4360871 Report a problem | ||
| 1/27/2005 | Sold | $262,450+22.6%$79/sqft |
Source: Public Record Report a problem | ||
| 8/7/2003 | Sold | $214,000+82.9%$64/sqft |
Source: Public Record Report a problem | ||
| 4/2/1997 | Sold | $117,000+18.5%$35/sqft |
Source: Public Record Report a problem | ||
| 5/31/1994 | Sold | $98,700$30/sqft |
Source: Public Record Report a problem | ||
| Year | Property taxes | Tax assessment |
|---|---|---|
| 2025 | $1,557 +1.6% | $68,370 -2.2% |
| 2024 | $1,533 +1.9% | $69,910 +360.3% |
| 2023 | $1,504 +2.8% | $15,188 -60.1% |
| 2022 | $1,463 -2.2% | $38,050 +7.8% |
| 2021 | $1,496 +3.6% | $35,310 +11.1% |
| 2020 | $1,443 +2.9% | $31,780 +48.4% |
| 2019 | $1,402 | $21,410 +3.5% |
| 2018 | $1,402 +6.4% | $20,680 +17.7% |
| 2017 | $1,317 +8% | $17,570 +15.7% |
| 2016 | $1,220 -0.4% | $15,180 +2.4% |
| 2015 | $1,225 | $14,830 +47.4% |
| 2014 | -- | $10,060 +13% |
| 2013 | -- | $8,900 -4.6% |
| 2012 | -- | $9,330 -20.4% |
| 2011 | -- | $11,720 -31.9% |
| 2010 | -- | $17,200 -33.2% |
| 2009 | -- | $25,760 -10.1% |
| 2008 | -- | $28,650 +10% |
| 2007 | -- | $26,050 +44.3% |
| 2006 | -- | $18,050 |
| 2005 | -- | $18,050 +22.8% |
| 2004 | -- | $14,700 |
| 2003 | -- | $14,700 +24.1% |
| 2002 | -- | $11,850 |
A local agent can set up tours, give advice and negotiate with sellers.


