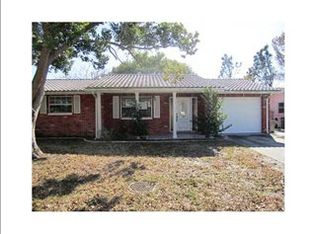
NEW CONSTRUCTION !!!!! NO HOA OR CDD FEES .This beautiful property with 3 beds, 2 baths , 2 car garage and open floor is ready for a new family . The kitchen including new stainless steel appliances, granite countertops, wood cabinets and open sitting area. This house have a beautiful ceramic flooring and sliding door stepping out to an enclosed patio . Call today for more details and to schedule a private showing. Convenient to shopping, restaurant etc, just a minute away from Little Rd, Publix and the Golden Acres shopping center. Go look and get this under contract so you can move into your brand new home!
Pre-foreclosure
Est. $308,200
8151 Redfield Dr, Port Richey, FL 34668
3beds
1,227sqft
SingleFamily
Built in 2019
5,950 Square Feet Lot
$308,200 Zestimate®
$251/sqft
$-- HOA
Overview
- 25 days |
- 9 |
- 0 |
Facts & features
Interior
Bedrooms & bathrooms
- Bedrooms: 3
- Bathrooms: 2
- Full bathrooms: 2
Heating
- Forced air
Cooling
- Central
Appliances
- Included: Dishwasher, Range / Oven, Refrigerator
Features
- Ceiling Fans(s), Eating Space In Kitchen, Kitchen/Family Room Combo, Stone Counters
- Flooring: Tile
Interior area
- Structure area source: Owner
- Total interior livable area: 1,227 sqft
Property
Parking
- Total spaces: 2
- Parking features: Garage - Attached
Features
- Levels: One
- Patio & porch: Enclosed
- Exterior features: Stucco
Lot
- Size: 5,950 Square Feet
- Residential vegetation: Fruit Trees
Details
- Parcel number: 2325160050000001320
- Zoning: R3
Construction
Type & style
- Home type: SingleFamily
Materials
- Concrete Block
- Roof: Asphalt
Condition
- Completed
- Year built: 2019
Utilities & green energy
- Sewer: Public Sewer
- Utilities for property: Public
Community & HOA
Community
- Subdivision: THE LAKES
Location
- Region: Port Richey
Financial & listing details
- Price per square foot: $251/sqft
- Tax assessed value: $309,368
- Annual tax amount: $5,471
Visit our professional directory to find a foreclosure specialist in your area that can help with your home search.
Find a foreclosure agentForeclosure details
Estimated market value
$308,200
$293,000 - $324,000
$1,781/mo
Price history
Price history
| Date | Event | Price |
|---|---|---|
| 5/19/2022 | Sold | $320,000+1.6%$261/sqft |
Source: Public Record Report a problem | ||
| 4/14/2022 | Pending sale | $315,000$257/sqft |
Source: | ||
| 4/11/2022 | Listed for sale | $315,000+63.6%$257/sqft |
Source: | ||
| 3/5/2020 | Sold | $192,500$157/sqft |
Source: Public Record Report a problem | ||
| 2/3/2020 | Price change | $192,500-2.8%$157/sqft |
Source: FRIENDS REALTY LLC #T3214675 Report a problem | ||
| 12/18/2019 | Listed for sale | $198,000+1585.1%$161/sqft |
Source: FRIENDS REALTY LLC #T3214675 Report a problem | ||
| 11/15/2018 | Sold | $11,750-8.9%$10/sqft |
Source: Public Record Report a problem | ||
| 10/24/2018 | Pending sale | $12,900$11/sqft |
Source: Owner Report a problem | ||
| 9/11/2018 | Listed for sale | $12,900+115%$11/sqft |
Source: Owner Report a problem | ||
| 8/1/2018 | Sold | $6,000-92.9%$5/sqft |
Source: Public Record Report a problem | ||
| 2/23/2004 | Sold | $84,200+53.1%$69/sqft |
Source: Public Record Report a problem | ||
| 11/25/1998 | Sold | $55,000+10%$45/sqft |
Source: Public Record Report a problem | ||
| 7/14/1997 | Sold | $50,000$41/sqft |
Source: Public Record Report a problem | ||
Public tax history
Public tax history
| Year | Property taxes | Tax assessment |
|---|---|---|
| 2024 | $5,471 +7.2% | $309,368 +7.9% |
| 2023 | $5,103 +124.9% | $286,587 +30.9% |
| 2022 | $2,269 +2.2% | $218,962 +30.9% |
| 2021 | $2,220 -14.2% | $167,286 +11.8% |
| 2020 | $2,586 +593% | $149,663 +1225.2% |
| 2019 | $373 | $11,294 -0.3% |
| 2018 | $373 +1.6% | $11,323 -0.3% |
| 2017 | $367 -1.1% | $11,353 -40.7% |
| 2016 | $371 -18.2% | $19,137 +4.8% |
| 2015 | $454 +10.7% | $18,264 +10.8% |
| 2014 | $410 | $16,482 +1.3% |
| 2013 | -- | $16,273 +0.6% |
| 2012 | -- | $16,168 -15.3% |
| 2011 | -- | $19,082 -61% |
| 2010 | -- | $48,946 -20% |
| 2009 | -- | $61,189 -22.1% |
| 2008 | -- | $78,576 -21.5% |
| 2007 | -- | $100,101 +6.4% |
| 2006 | -- | $94,073 +26.1% |
| 2005 | -- | $74,586 +19.8% |
| 2004 | -- | $62,237 +15.5% |
| 2003 | -- | $53,883 +4.9% |
| 2002 | -- | $51,390 +19.3% |
| 2000 | -- | $43,067 |
| 1999 | -- | $43,067 |
Find assessor info on the county website
BuyAbility℠ payment
Estimated monthly payment
Boost your down payment with 6% savings match
Earn up to a 6% match & get a competitive APY with a *. Zillow has partnered with to help get you home faster.
Learn more*Terms apply. Match provided by Foyer. Account offered by Pacific West Bank, Member FDIC.Climate risks
Neighborhood: 34668
Nearby schools
GreatSchools rating
- 1/10Fox Hollow Elementary SchoolGrades: PK-5Distance: 0.2 mi
- 2/10Bayonet Point Middle SchoolGrades: 6-8Distance: 1.5 mi
- 2/10Fivay High SchoolGrades: 9-12Distance: 2.6 mi