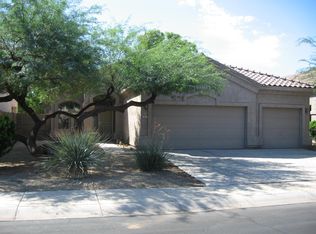
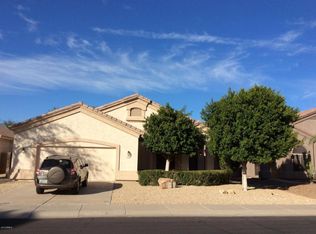
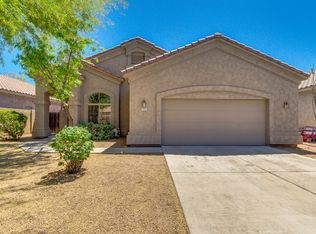
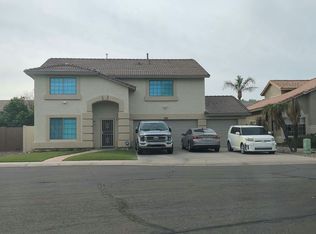
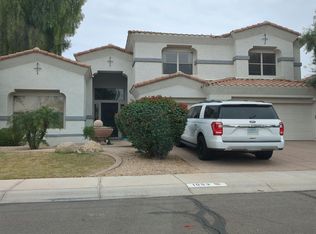
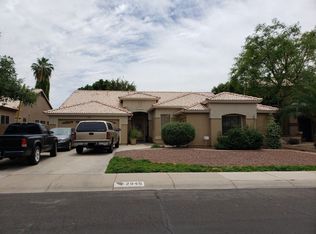
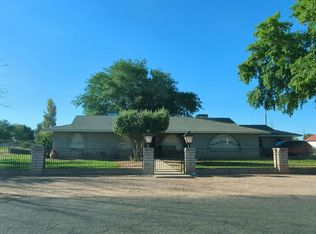
This 2752 square foot single family home has 4 bedrooms and 3.0 bathrooms. This home is located at 711 E Ranch Rd, Gilbert, AZ 85296.
Pre-foreclosure
Est. $631,800
711 E Ranch Rd, Gilbert, AZ 85296
4beds
3baths
2,752sqft
SingleFamily
Built in 1998
6,385 Square Feet Lot
$631,800 Zestimate®
$230/sqft
$28/mo HOA
Overview
- 141 days |
- 90 |
- 2 |
Facts & features
Interior
Bedrooms & bathrooms
- Bedrooms: 4
- Bathrooms: 3
Heating
- Other, Gas
Cooling
- Refrigerator
Appliances
- Included: Dishwasher, Microwave, Range / Oven
- Laundry: Inside Laundry, Wshr/Dry HookUp Only
Features
- Flooring: Tile, Carpet
- Has fireplace: Yes
Interior area
- Total interior livable area: 2,752 sqft
Property
Parking
- Total spaces: 4
- Parking features: Garage - Attached
Features
- Exterior features: Wood
- Fencing: Block
Lot
- Size: 6,385 Square Feet
Details
- Parcel number: 30914481
Construction
Type & style
- Home type: SingleFamily
Materials
- Roof: Other
Condition
- Year built: 1998
Utilities & green energy
- Sewer: Sewer - Public, Sewer in & Cnctd
- Utilities for property: SRP
Community & HOA
HOA
- Has HOA: Yes
- HOA fee: $28 monthly
Location
- Region: Gilbert
Financial & listing details
- Price per square foot: $230/sqft
- Tax assessed value: $501,500
- Annual tax amount: $2,241
- Ownership: Fee Simple
Visit our professional directory to find a foreclosure specialist in your area that can help with your home search.
Find a foreclosure agentForeclosure details
Estimated market value
$631,800
$600,000 - $663,000
$3,253/mo
Price history
Price history
| Date | Event | Price |
|---|---|---|
| 8/27/2018 | Sold | $395,000-1%$144/sqft |
Source: | ||
| 7/20/2018 | Price change | $399,000-0.2%$145/sqft |
Source: Revelation Real Estate #5757672 Report a problem | ||
| 7/13/2018 | Price change | $399,9000%$145/sqft |
Source: Revelation Real Estate #5757672 Report a problem | ||
| 6/21/2018 | Price change | $399,999-2.4%$145/sqft |
Source: Revelation Real Estate #5757672 Report a problem | ||
| 6/14/2018 | Price change | $410,000-1.2%$149/sqft |
Source: Revelation Real Estate #5757672 Report a problem | ||
| 5/8/2018 | Price change | $415,000-1.8%$151/sqft |
Source: Revelation Real Estate #5757672 Report a problem | ||
| 5/4/2018 | Price change | $422,500-0.4%$154/sqft |
Source: Revelation Real Estate #5757672 Report a problem | ||
| 5/2/2018 | Price change | $424,000-0.2%$154/sqft |
Source: Revelation Real Estate #5757672 Report a problem | ||
| 4/6/2018 | Listed for sale | $425,000+40.3%$154/sqft |
Source: Owner Report a problem | ||
| 6/1/2008 | Listing removed | -- |
Source: Single Property Sites, Inc #2950295 Report a problem | ||
| 3/12/2008 | Listed for sale | -- |
Source: Single Property Sites, Inc #2950295 Report a problem | ||
| 1/31/2005 | Sold | $303,000+45.1%$110/sqft |
Source: | ||
| 7/8/1998 | Sold | $208,828+0.9%$76/sqft |
Source: Public Record Report a problem | ||
| 2/13/1998 | Sold | $207,000$75/sqft |
Source: Public Record Report a problem | ||
Public tax history
Public tax history
| Year | Property taxes | Tax assessment |
|---|---|---|
| 2025 | $2,241 +4% | $50,150 -6.2% |
| 2024 | $2,155 -0.9% | $53,480 +96.5% |
| 2023 | $2,174 +1.4% | $27,218 -19.5% |
| 2022 | $2,143 -3.8% | $33,800 +4.6% |
| 2021 | $2,228 +8.8% | $32,320 +6.8% |
| 2020 | $2,048 +3.1% | $30,260 +7.6% |
| 2019 | $1,987 | $28,130 +4.3% |
| 2018 | $1,987 +3.6% | $26,980 +6.9% |
| 2017 | $1,918 +6% | $25,250 +3.2% |
| 2016 | $1,810 -4.7% | $24,460 +3.3% |
| 2015 | $1,898 | $23,680 +25% |
| 2014 | -- | $18,950 +18.8% |
| 2013 | -- | $15,950 -5.2% |
| 2012 | -- | $16,820 -5.3% |
| 2011 | -- | $17,770 -11.8% |
| 2010 | -- | $20,150 -18.4% |
| 2009 | -- | $24,700 -16.6% |
| 2008 | -- | $29,600 +5.7% |
| 2007 | -- | $28,000 +60.5% |
| 2006 | -- | $17,450 |
| 2005 | -- | $17,450 +8% |
| 2004 | -- | $16,150 |
| 2003 | -- | $16,150 +12.9% |
| 2002 | -- | $14,300 |
Find assessor info on the county website
Monthly payment
Estimated monthly payment
All calculations are estimates and provided by Zillow, Inc. for informational purposes only. Actual amounts may vary.
HOA fees may include property taxes on listings classified as Co-Ops. Contact the listing agent and/or owner for fee details.
Mortgage interest rates are dependent on a number of factors, including credit score, down payment, and repayment length. Interest rate data provided by Zillow Group Marketplace, Inc. as of 1/1/1970 from various mortgage lenders with which we have lead or other similar arrangements; the Estimated Payment is an average of those rates.
See how much you could borrow to make a competitive offer.
Climate risks
Neighborhood: Neely Farms
Nearby schools
GreatSchools rating
- 7/10Settlers Point Elementary SchoolGrades: PK-6Distance: 0.4 mi
- 5/10Mesquite Jr High SchoolGrades: 6-8Distance: 1.4 mi
- 6/10Mesquite High SchoolGrades: 8-12Distance: 3 mi
Schools provided by the listing agent
- Elementary: San Tan Elementary
- Middle: Cooley Middle School
- High: Williams Field High School
- District: Higley Unified District (060)
Source: The MLS. This data may not be complete. We recommend contacting the local school district to confirm school assignments for this home.
- Arizona
- Maricopa County
- Gilbert
- 85296
- Neely Farms
- 711 E Ranch Rd
Nearby cities
Nearby neighborhoods
Nearby zip codes
Other Gilbert Topics
