$369,100
-- bd|2 ba|960 sqft
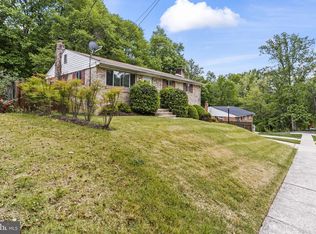
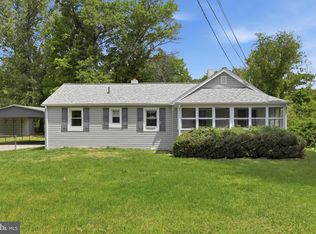
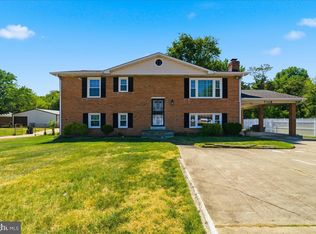
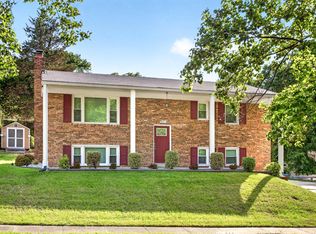
3601 Oakmont Dr, Fort Washington, MD 20744
Off Market
Zillow last checked:
Listing updated:
Regina Pierce 301-775-5454,
Fairfax Realty Premier 3014399500
$308,600
$284,000 - $330,000
$2,061/mo
| Date | Event | Price |
|---|---|---|
| 3/21/2025 | Listing removed | $1,950$2/sqft |
Source: Zillow Rentals Report a problem | ||
| 3/9/2025 | Listed for rent | $1,950+6.8%$2/sqft |
Source: Zillow Rentals Report a problem | ||
| 2/18/2025 | Listing removed | $299,990$312/sqft |
Source: | ||
| 2/10/2025 | Listed for sale | $299,990$312/sqft |
Source: | ||
| 1/30/2025 | Contingent | $299,990$312/sqft |
Source: | ||
| 1/12/2025 | Listed for sale | $299,990$312/sqft |
Source: | ||
| 12/29/2024 | Contingent | $299,990$312/sqft |
Source: | ||
| 12/21/2024 | Listed for sale | $299,990+15.4%$312/sqft |
Source: | ||
| 9/20/2024 | Listing removed | $260,000$271/sqft |
Source: | ||
| 9/11/2024 | Listed for sale | $260,000$271/sqft |
Source: | ||
| 9/11/2024 | Contingent | $260,000$271/sqft |
Source: | ||
| 8/31/2024 | Listed for sale | $260,000-13.3%$271/sqft |
Source: | ||
| 8/17/2024 | Listing removed | -- |
Source: | ||
| 7/13/2024 | Listed for sale | $300,000$313/sqft |
Source: | ||
| 6/25/2024 | Contingent | $300,000$313/sqft |
Source: | ||
| 6/21/2024 | Price change | $300,000-7.7%$313/sqft |
Source: | ||
| 6/15/2024 | Listed for sale | $325,000+108.3%$339/sqft |
Source: | ||
| 2/5/2023 | Listing removed | -- |
Source: Zillow Rentals Report a problem | ||
| 1/26/2023 | Listed for rent | $1,825+21.7%$2/sqft |
Source: Zillow Rentals Report a problem | ||
| 4/6/2020 | Listing removed | $1,500$2/sqft |
Source: Griffin Property Management, LLC Report a problem | ||
| 3/12/2020 | Listed for rent | $1,500$2/sqft |
Source: Zillow Rental Network Report a problem | ||
| 2/2/2019 | Listing removed | $1,500$2/sqft |
Source: Griffin Property Management, LLC Report a problem | ||
| 1/2/2019 | Listed for rent | $1,500$2/sqft |
Source: Griffin Property Management, LLC Report a problem | ||
| 10/8/2015 | Sold | $156,000+15.6%$163/sqft |
Source: Public Record Report a problem | ||
| 1/1/2015 | Sold | $135,000$141/sqft |
Source: | ||
| 8/28/2003 | Sold | $135,000$141/sqft |
Source: Public Record Report a problem | ||
| Year | Property taxes | Tax assessment |
|---|---|---|
| 2025 | $4,795 +94.7% | $235,700 +6.4% |
| 2024 | $2,462 +6.9% | $221,433 +6.9% |
| 2023 | $2,304 +7.4% | $207,167 +7.4% |
| 2022 | $2,145 +1.7% | $192,900 +1.7% |
| 2021 | $2,110 +1.7% | $189,767 +1.7% |
| 2020 | $2,075 -21.5% | $186,633 +4.9% |
| 2019 | $2,643 | $177,833 |
| 2018 | $2,643 +3.3% | $177,833 +3.3% |
| 2017 | $2,558 +6.3% | $172,167 +3.4% |
| 2016 | $2,407 | $166,500 |
| 2015 | $2,407 | $166,500 |
| 2014 | $2,407 | $166,500 -6.5% |
| 2013 | -- | $178,100 |
| 2012 | -- | $178,100 |
| 2011 | -- | $178,100 -24.5% |
| 2010 | -- | $235,920 +11.4% |
| 2009 | -- | $211,720 +12.9% |
| 2008 | -- | $187,520 +14.8% |
| 2007 | -- | $163,320 +13.4% |
| 2006 | -- | $144,072 +15.4% |
| 2005 | -- | $124,826 +18.2% |
| 2004 | -- | $105,580 |
| 2003 | -- | $105,580 +4.4% |
| 2002 | -- | $101,146 +9.6% |
| 2001 | -- | $92,280 |
Find assessor info on the county website
Source: Bright MLS. This data may not be complete. We recommend contacting the local school district to confirm school assignments for this home.
A local agent can set up tours, give advice and negotiate with sellers.