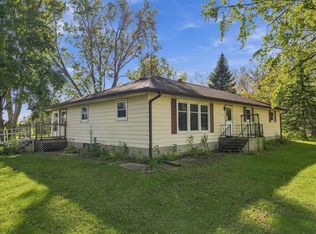
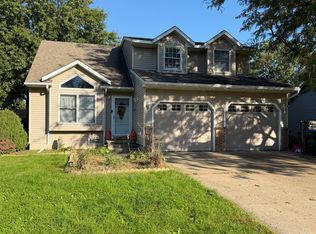
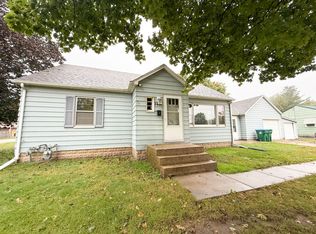
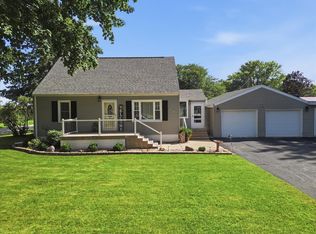
$109,000
-- bd-- ba1.4k sqft
2806 A St, Rock Falls, IL 61071
Off Market
Listing description withheld by the listing agent.
Zillow last checked:
Listing updated:
Jeannie Fisher (815)213-1266,
eXp Realty

$223,200
$212,000 - $234,000
$1,398/mo
| Date | Event | Price |
|---|---|---|
| 10/20/2026 | Listed for sale | $230,000+84.1%$164/sqft |
Source:  MRED as distributed by MLS GRID #12788328 Report a problem | ||
| 10/5/2016 | Listing removed | $124,900$89/sqft |
Source: RE/MAX Sauk Valley #09276721 Report a problem | ||
| 9/6/2016 | Pending sale | $124,900$89/sqft |
Source: RE/MAX Sauk Valley #09276721 Report a problem | ||
| 7/5/2016 | Listed for sale | $124,900$89/sqft |
Source: Re/Max Sauk Valley #09276721 Report a problem | ||
| 5/7/2016 | Listing removed | $124,900$89/sqft |
Source: RE/MAX Sauk Valley #09186181 Report a problem | ||
| 4/21/2016 | Pending sale | $124,900$89/sqft |
Source: RE/MAX Sauk Valley #09186181 Report a problem | ||
| 4/7/2016 | Listed for sale | $124,900$89/sqft |
Source: RE/MAX Sauk Valley #09186181 Report a problem | ||
| 9/2/2015 | Listing removed | $124,900$89/sqft |
Source: RE/MAX Sauk Valley #08763272 Report a problem | ||
| 7/14/2015 | Price change | $124,900-0.8%$89/sqft |
Source: RE/MAX Sauk Valley #08763272 Report a problem | ||
| 2/27/2015 | Price change | $125,900-1.6%$90/sqft |
Source: RE/MAX Sauk Valley RMNI #08763272 Report a problem | ||
| 10/30/2014 | Listed for sale | $127,900$91/sqft |
Source: RE/MAX Sauk Valley RMNI #08763272 Report a problem | ||
| 7/26/2014 | Listing removed | $127,900$91/sqft |
Source: RE/MAX Sauk Valley RMNI #121434 Report a problem | ||
| 3/4/2014 | Listed for sale | $127,900$91/sqft |
Source: RE/MAX Sauk Valley RMNI #08395334 Report a problem | ||
| Year | Property taxes | Tax assessment |
|---|---|---|
| 2024 | $2,678 +10.2% | $40,205 +8.4% |
| 2023 | $2,429 +8.8% | $37,079 +7% |
| 2022 | $2,233 +19.7% | $34,661 +5.7% |
| 2021 | $1,865 -11.1% | $32,792 +1.7% |
| 2020 | $2,099 +7.5% | $32,231 +3.7% |
| 2019 | $1,953 +6.4% | $31,078 +2.3% |
| 2018 | $1,835 +0.2% | $30,385 +1.9% |
| 2017 | $1,831 +2.5% | $29,816 +1.7% |
| 2016 | $1,786 -4.8% | $29,315 -4.8% |
| 2015 | $1,876 +926.7% | $30,793 +2.7% |
| 2014 | $183 -90.3% | $29,971 -2.7% |
| 2013 | $1,876 -5.5% | $30,793 |
| 2012 | $1,985 +1% | $30,793 -9.7% |
| 2011 | $1,967 +1% | $34,117 -0.7% |
| 2010 | $1,946 +1.6% | $34,341 +0% |
| 2009 | $1,916 -4.3% | $34,327 +2.1% |
| 2008 | $2,001 -2.4% | $33,614 +7% |
| 2007 | $2,051 | $31,416 +1.4% |
| 2005 | -- | $30,991 |
Source: MRED as distributed by MLS GRID. This data may not be complete. We recommend contacting the local school district to confirm school assignments for this home.

A local agent can set up tours, give advice and negotiate with sellers.
A local lender can help you make sure your offer is ready when you are.