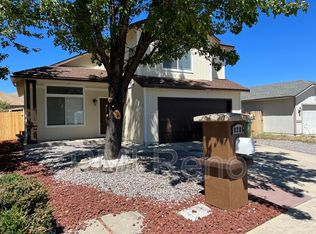
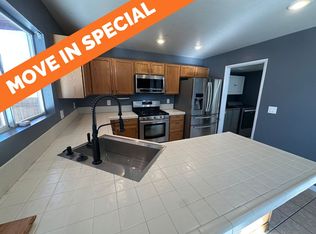
Rural home on 12 acres. This three bedroom one bathroom home sit on horse property. Kitchen includes refrigerator and electric stove as well as tile flooring. Hardwood flooring in the living areas. Window air conditioning is included as well as washer and dryer. Heating is propane. Tenants are responsible for NV energy, propane and trash.
This is a one year lease. Our office is located at 1170 South Rock Blvd., Ste.3 Reno, NV 89502, and is open seven days a week. Call us today at (775)342-5478 or visit us at www.RenoRentalFinders.com for all of our current listings! Rental application fee of $30 per adult.
<br> <br>
Reno Rental Finders | Hello@RenoRentalFinders.com | www.RenoRentalFinders.com | 1170 South Rock Blvd., Ste. 3, Reno, NV 89502 | 775-342-5478 | OPEN 7 DAYS A WEEK FOR VIEWING APPOINTMENTS
Pre-foreclosure
Est. $6,421,781
8805 Red Rock Rd, Reno, NV 89508
3beds
1baths
1,104sqft
SingleFamily
Built in 1973
4.39 Acres Lot
$-- Zestimate®
$5,817/sqft
$72/mo HOA
Overview
- 261 days |
- 13 |
- 0 |
Facts & features
Interior
Bedrooms & bathrooms
- Bedrooms: 3
- Bathrooms: 1
Heating
- None, Forced air
Cooling
- None
Appliances
- Included: Range / Oven, Refrigerator, Washer
Interior area
- Total interior livable area: 1,104 sqft
Property
Parking
- Parking features: Off-street
Features
- Exterior features: Stucco, Cement / Concrete, Metal
Lot
- Size: 4.39 Acres
Details
- Parcel number: 08735033
Construction
Type & style
- Home type: SingleFamily
Materials
- Metal
- Roof: Composition
Condition
- Year built: 1973
Community & HOA
HOA
- Has HOA: Yes
- HOA fee: $72 monthly
Location
- Region: Reno
Financial & listing details
- Price per square foot: $5,817/sqft
- Tax assessed value: $6,421,781
- Annual tax amount: $75,005
Visit our professional directory to find a foreclosure specialist in your area that can help with your home search.
Find a foreclosure agentForeclosure details
Estimated market value
Not available
Estimated sales range
Not available
$2,069/mo
Price history
Price history
| Date | Event | Price |
|---|---|---|
| 8/8/2018 | Sold | $100,000-33.3%$91/sqft |
Source: Public Record Report a problem | ||
| 2/29/2016 | Listing removed | $1,500$1/sqft |
Source: Reno Rental Finders | 1170 South Rock Blvd. #3, Reno, NV 89502 | Report a problem | ||
| 2/20/2016 | Listed for rent | $1,500+15.4%$1/sqft |
Source: Reno Rental Finders | 1170 South Rock Blvd. #3, Reno, NV 89502 | Report a problem | ||
| 3/3/2015 | Listing removed | $1,300$1/sqft |
Source: Reno Rental Finders | 1170 South Rock Blvd. #3, Reno, NV 89502 | Report a problem | ||
| 2/11/2015 | Listed for rent | $1,300+45.3%$1/sqft |
Source: Reno Rental Finders | 1170 South Rock Blvd. #3, Reno, NV 89502 | Report a problem | ||
| 4/30/2014 | Sold | $150,000+240.9%$136/sqft |
Source: Public Record Report a problem | ||
| 9/20/2011 | Listing removed | $895$1/sqft |
Source: Corazon Real Estate Report a problem | ||
| 7/23/2011 | Listed for rent | $895$1/sqft |
Source: Corazon Real Estate Report a problem | ||
| 5/8/2006 | Sold | $44,000-59.6%$40/sqft |
Source: Public Record Report a problem | ||
| 10/15/2002 | Sold | $109,000-60.4%$99/sqft |
Source: Public Record Report a problem | ||
| 2/18/1999 | Sold | $275,000$249/sqft |
Source: Public Record Report a problem | ||
Public tax history
Public tax history
| Year | Property taxes | Tax assessment |
|---|---|---|
| 2025 | $75,005 +8% | $2,247,623 -1.6% |
| 2024 | $69,442 | $2,283,895 +206% |
| 2023 | -- | $746,252 +82.9% |
| 2022 | $1,940 +6.4% | $408,074 +572.8% |
| 2021 | $1,824 +5% | $60,652 -1.5% |
| 2020 | $1,737 -4.8% | $61,555 |
| 2019 | $1,824 +5% | $61,555 +9.5% |
| 2018 | $1,737 +12% | $56,231 +0.4% |
| 2017 | $1,550 | $55,998 +0.9% |
| 2016 | $1,550 | $55,500 +14.7% |
| 2015 | $1,550 +3.4% | $48,396 +4.1% |
| 2014 | $1,499 | $46,501 +3.5% |
| 2013 | $1,499 | $44,913 |
| 2012 | -- | $44,913 +0.9% |
| 2011 | -- | $44,511 -10.6% |
| 2010 | -- | $49,810 -17.5% |
| 2009 | -- | $60,359 -41.7% |
| 2008 | -- | $103,579 -1.6% |
| 2007 | -- | $105,254 +141.7% |
| 2006 | -- | $43,550 +7.9% |
| 2005 | -- | $40,354 +6.8% |
| 2004 | -- | $37,797 -0.8% |
| 2003 | -- | $38,116 +1.4% |
| 2002 | -- | $37,587 |
| 2001 | -- | $37,587 |
Find assessor info on the county website
BuyAbility℠ payment
Estimated monthly payment
Boost your down payment with 6% savings match
Earn up to a 6% match & get a competitive APY with a *. Zillow has partnered with to help get you home faster.
Learn more*Terms apply. Match provided by Foyer. Account offered by Pacific West Bank, Member FDIC.Climate risks
Neighborhood: Cold Springs
Nearby schools
GreatSchools rating
- 3/10Silver Lake Elementary SchoolGrades: K-5Distance: 0.9 mi
- 2/10Cold Springs Middle SchoolsGrades: 6-8Distance: 4.7 mi
- 2/10North Valleys High SchoolGrades: 9-12Distance: 5.3 mi