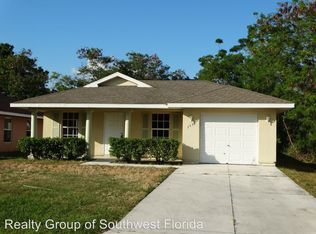
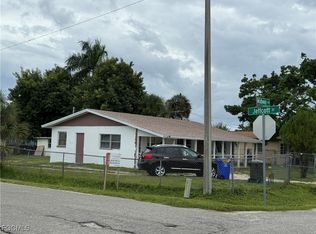
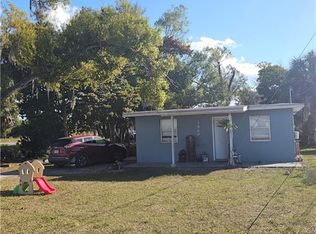
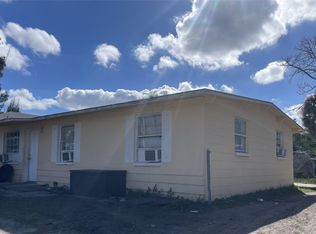
Affordable and Updated 3 bedroom, 2 bath, 1 car garage with 1,032 sq. ft. of living space on a nice size lot. This home is centrally located in Fort Myers as it is close to Cleveland Ave, shopping, restaurants, hospital, schools and more. This home has a brand New AC unit, tile flooring, freshly painted inside and out. Kitchen has new granite countertops and appliances are in great working condition. Great starter home or rental property priced to sell at $159,900. Great home for the price. Bring your offers this house will not last!
Pre-foreclosure
Est. $206,100
3529 South St, Fort Myers, FL 33916
3beds
1,032sqft
SingleFamily
Built in 2007
7,000 Square Feet Lot
$206,100 Zestimate®
$200/sqft
$-- HOA
Overview
- 60 days |
- 138 |
- 6 |
Facts & features
Interior
Bedrooms & bathrooms
- Bedrooms: 3
- Bathrooms: 2
- Full bathrooms: 2
Heating
- Forced air, Electric
Cooling
- Central
Appliances
- Included: Dishwasher, Microwave, Range / Oven, Refrigerator
Features
- Flooring: Tile
Interior area
- Total interior livable area: 1,032 sqft
Property
Parking
- Total spaces: 1
- Parking features: Garage - Attached
Features
- Exterior features: Stucco, Wood
- Has view: Yes
- View description: None
Lot
- Size: 7,000 Square Feet
Details
- Parcel number: 194425P3009170190
Construction
Type & style
- Home type: SingleFamily
Materials
- Frame
- Roof: Asphalt
Condition
- Year built: 2007
Community & HOA
Location
- Region: Fort Myers
Financial & listing details
- Price per square foot: $200/sqft
- Tax assessed value: $164,164
- Annual tax amount: $3,232
Visit our professional directory to find a foreclosure specialist in your area that can help with your home search.
Find a foreclosure agentForeclosure details
Estimated market value
$206,100
$192,000 - $221,000
$1,739/mo
Price history
Price history
| Date | Event | Price |
|---|---|---|
| 8/10/2021 | Sold | $161,000+0.7%$156/sqft |
Source: | ||
| 7/13/2021 | Pending sale | $159,900$155/sqft |
Source: | ||
| 7/6/2021 | Listed for sale | $159,900+77.7%$155/sqft |
Source: | ||
| 3/3/2021 | Sold | $90,000+38.5%$87/sqft |
Source: Public Record Report a problem | ||
| 3/26/2015 | Sold | $65,000-7%$63/sqft |
Source: Public Record Report a problem | ||
| 3/3/2015 | Listed for sale | $69,900+79.7%$68/sqft |
Source: Bay Vision Realty #215014497 Report a problem | ||
| 6/4/2013 | Sold | $38,900-0.3%$38/sqft |
Source: Public Record Report a problem | ||
| 2/15/2013 | Pending sale | $39,000$38/sqft |
Source: Century 21 Birchwood Rlty, Inc #201306252 Report a problem | ||
| 2/13/2013 | Listed for sale | $39,000-76.3%$38/sqft |
Source: Century 21 Birchwood Rlty, Inc #201306252 Report a problem | ||
| 7/23/2007 | Sold | $164,900+1549%$160/sqft |
Source: Public Record Report a problem | ||
| 5/11/2005 | Sold | $10,000$10/sqft |
Source: Public Record Report a problem | ||
Public tax history
Public tax history
| Year | Property taxes | Tax assessment |
|---|---|---|
| 2025 | $3,232 +4.5% | $156,094 +10% |
| 2024 | $3,094 +10.8% | $141,904 +10% |
| 2023 | $2,792 +6.4% | $129,004 +10% |
| 2022 | $2,625 +26.5% | $117,276 +63% |
| 2021 | $2,074 +10.9% | $71,929 +10% |
| 2020 | $1,870 +10.4% | $65,390 -12% |
| 2019 | $1,694 | $74,291 +13.6% |
| 2018 | $1,694 +6.2% | $65,400 +15.7% |
| 2017 | $1,595 +7.9% | $56,515 +26.5% |
| 2016 | $1,479 +10.8% | $44,662 -12.3% |
| 2015 | $1,335 -6.3% | $50,907 +19.8% |
| 2014 | $1,425 +17.5% | $42,501 -2.3% |
| 2013 | $1,213 +42.5% | $43,502 +52.7% |
| 2012 | $851 +0% | $28,496 -2.9% |
| 2011 | $851 +6.6% | $29,357 +16.2% |
| 2010 | $798 -53.3% | $25,273 -65% |
| 2009 | $1,709 -30% | $72,140 -42.5% |
| 2008 | $2,443 +1331% | $125,400 +1266% |
| 2007 | $171 -46.7% | $9,180 -43.8% |
| 2006 | $320 +183% | $16,320 +220% |
| 2004 | $113 -5.5% | $5,100 |
| 2003 | $120 +16% | $5,100 |
| 2002 | $103 | $5,100 +25% |
| 2000 | -- | $4,080 |
Find assessor info on the county website
Monthly payment
Estimated monthly payment
All calculations are estimates and provided by Zillow, Inc. for informational purposes only. Actual amounts may vary.
HOA fees may include property taxes on listings classified as Co-Ops. Contact the listing agent and/or owner for fee details.
Mortgage interest rates are dependent on a number of factors, including credit score, down payment, and repayment length. Interest rate data provided by Zillow Group Marketplace, Inc. as of 1/1/1970 from various mortgage lenders with which we have lead or other similar arrangements; the Estimated Payment is an average of those rates.
See how much you could borrow to make a competitive offer.
Climate risks
Neighborhood: 33916
Nearby schools
GreatSchools rating
- 5/10Franklin Park Elementary SchoolGrades: PK-5Distance: 0.5 mi
- 2/10Fort Myers Middle AcademyGrades: 6-8Distance: 1.7 mi
- 2/10Dunbar High SchoolGrades: 9-12Distance: 0.4 mi


- Florida
- Lee County
- Fort Myers
- 33916
- 3529 South St
Nearby cities
Nearby neighborhoods
Nearby zip codes
Other Fort Myers Topics
