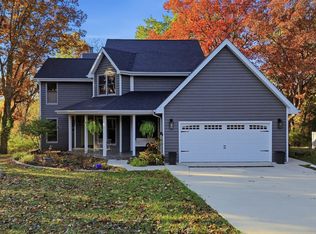
$362,100
3 bd|3 ba|3.6k sqft
305 Knollwood Dr, Dixon, IL 61021
Off Market
Zillow last checked: 8 hours ago
Listing updated: February 22, 2026 at 10:07pm
Christina Hopkins 808-428-9015,
Compass
$577,600
$549,000 - $606,000
$3,359/mo
| Date | Event | Price |
|---|---|---|
| 2/17/2026 | Listed for sale | $599,999+26.6%$140/sqft |
Source: | ||
| 12/16/2024 | Sold | $474,000$110/sqft |
Source: | ||
| 11/11/2024 | Contingent | $474,000$110/sqft |
Source: | ||
| 6/28/2024 | Listed for sale | $474,000$110/sqft |
Source: | ||
| 6/17/2024 | Listing removed | -- |
Source: | ||
| 5/22/2024 | Contingent | $474,000$110/sqft |
Source: | ||
| 4/15/2024 | Price change | $474,000-4%$110/sqft |
Source: | ||
| 3/18/2024 | Listed for sale | $494,000$115/sqft |
Source: | ||
| 10/9/2023 | Listing removed | -- |
Source: | ||
| 6/23/2023 | Listed for sale | $494,000+74.9%$115/sqft |
Source: | ||
| 12/11/2020 | Sold | $282,500-2.6%$66/sqft |
Source: Public Record Report a problem | ||
| 9/30/2020 | Pending sale | $290,000$67/sqft |
Source: Rex Real Estate Exchange Report a problem | ||
| 9/1/2020 | Price change | $290,000-1.7%$67/sqft |
Source: Rex Real Estate Exchange Report a problem | ||
| 8/30/2019 | Price change | $295,000-3.3%$69/sqft |
Source: Rex Real Estate Exchange Report a problem | ||
| 6/28/2019 | Listed for sale | $305,000-4.7%$71/sqft |
Source: Rex Real Estate Exchange Report a problem | ||
| 6/11/2019 | Listing removed | $320,000$74/sqft |
Source: 4 Sale Realty Advantage #10043500 Report a problem | ||
| 8/7/2018 | Listed for sale | $320,000$74/sqft |
Source: 4 Sale Realty Advantage #10043500 Report a problem | ||
| 8/6/2018 | Pending sale | $320,000$74/sqft |
Source: Owner Report a problem | ||
| 7/24/2018 | Listed for sale | $320,000$74/sqft |
Source: Owner Report a problem | ||
| Year | Property taxes | Tax assessment |
|---|---|---|
| 2024 | $11,617 +3.8% | $149,352 +4.1% |
| 2023 | $11,187 +7.1% | $143,524 +9% |
| 2022 | $10,444 +4% | $131,637 +3.9% |
| 2021 | $10,041 +10.6% | $126,672 +7.5% |
| 2020 | $9,080 +18.4% | $117,834 +12.9% |
| 2018 | $7,671 +3% | $104,393 +3.6% |
| 2017 | $7,449 +9.1% | $100,766 +1% |
| 2016 | $6,829 -4.6% | $99,729 +1.6% |
| 2015 | $7,156 -2.8% | $98,158 |
| 2014 | $7,364 -4.4% | $98,158 -3% |
| 2013 | $7,700 | $101,152 -5.2% |
| 2012 | -- | $106,735 -5.9% |
| 2011 | -- | $113,405 -13.4% |
| 2010 | -- | $130,986 |
| 2009 | -- | $130,986 |
| 2008 | $8,966 +10.3% | $130,986 +8.8% |
| 2007 | $8,128 | $120,427 |
Find assessor info on the county website
Source: MRED as distributed by MLS GRID. This data may not be complete. We recommend contacting the local school district to confirm school assignments for this home.