Great home right in the heart of downtown Marine City!
For sale
$185,000
1024 S Belle River Ave, Marine City, MI 48039
3beds
1,796sqft
Single Family Residence
Built in 1941
0.89 Acres Lot
$175,200 Zestimate®
$103/sqft
$-- HOA
What's special
- 1 day
- 168
- 10
Zillow last checked:
Listing updated:
Listed by:
Stephan Furstenau,
iHome Realty, Inc. 810-841-3031
Source: MiRealSource,MLS#: 50227598 Originating MLS: MiRealSource
Facts & features
Interior
Bedrooms & bathrooms
- Bedrooms: 3
- Bathrooms: 1
- Full bathrooms: 1
Bedroom 1
- Level: First
- Width: 12
Bedroom 2
- Level: First
- Area: 117
- Dimensions: 13 x 9
Bedroom 3
- Level: First
- Area: 108
- Dimensions: 12 x 9
Bathroom 1
- Level: First
Heating
- Forced Air, Natural Gas
Features
- Has basement: Yes
- Has fireplace: No
Interior area
- Total structure area: 2,986
- Total interior livable area: 1,796 sqft
- Finished area above ground: 1,796
- Finished area below ground: 0
Property
Features
- Levels: One and One Half
- Stories: 1.5
- Frontage type: Road
- Frontage length: 75
Lot
- Size: 0.89 Acres
- Dimensions: 43 x 74
Details
- Parcel number: 020122007000
- Special conditions: Private
Construction
Type & style
- Home type: SingleFamily
- Architectural style: Colonial
- Property subtype: Single Family Residence
Materials
- Brick
- Foundation: Basement
Condition
- Year built: 1941
Utilities & green energy
- Sewer: Public Sanitary
- Water: Public
Community & HOA
Community
- Subdivision: Scotts Sub
HOA
- Has HOA: No
Location
- Region: Marine City
Financial & listing details
- Price per square foot: $103/sqft
- Tax assessed value: $122,600
- Annual tax amount: $3,578
- Date on market: 11/13/2026
- Listing agreement: Exclusive Right To Sell
- Listing terms: Cash,Conventional,FHA,VA Loan
Estimated market value
$175,200
$149,000 - $201,000
$1,475/mo
Price history
| Date | Event | Price |
|---|---|---|
| 11/13/2026 | Listed for sale | $185,000+58%$103/sqft |
Source:  MiRealSource #50227598 Report a problem | ||
| 12/20/2024 | Sold | $117,100-16.3%$65/sqft |
Source: MiRealSource #50150439 Report a problem | ||
| 12/4/2024 | Pending sale | $139,900$78/sqft |
Source: MiRealSource #50150439 Report a problem | ||
| 11/20/2024 | Price change | $139,900-6.7%$78/sqft |
Source: MiRealSource #50150439 Report a problem | ||
| 11/7/2024 | Listed for sale | $149,900$83/sqft |
Source: MiRealSource #50150439 Report a problem | ||
| 10/4/2024 | Listing removed | $149,900-3.2%$83/sqft |
Source: MiRealSource #50150439 Report a problem | ||
| 8/27/2024 | Price change | $154,900-3.1%$86/sqft |
Source: MiRealSource #50150439 Report a problem | ||
| 7/31/2024 | Listed for sale | $159,900$89/sqft |
Source: MiRealSource #50150439 Report a problem | ||
| 7/8/2024 | Listing removed | $159,900$89/sqft |
Source: MiRealSource #50147627 Report a problem | ||
| 7/6/2024 | Listed for sale | $159,900$89/sqft |
Source: MiRealSource #50147627 Report a problem | ||
Public tax history
| Year | Property taxes | Tax assessment |
|---|---|---|
| 2026 | -- | $61,300 +4.8% |
| 2025 | $1,890 +5% | $58,500 +1.2% |
| 2024 | $1,800 +1.9% | $57,800 +2.5% |
| 2023 | $1,767 +4.6% | $56,400 +13% |
| 2022 | $1,689 | $49,900 +9.2% |
| 2021 | -- | $45,700 -1.7% |
| 2020 | -- | $46,500 -4.5% |
| 2019 | $1,579 | $48,700 +3.2% |
| 2018 | -- | $47,200 +12.6% |
| 2017 | $1,633 +3.6% | $41,900 |
| 2016 | $1,575 | $41,900 +11.1% |
| 2015 | $1,575 | $37,700 +5.6% |
| 2014 | -- | $35,700 +4.4% |
| 2013 | -- | $34,200 +1.8% |
| 2012 | -- | $33,600 -4% |
| 2011 | -- | $35,000 |
| 2010 | -- | $35,000 -26.9% |
| 2009 | -- | $47,900 -24% |
| 2008 | -- | $63,000 -2.3% |
| 2007 | -- | $64,470 +1564.2% |
| 2006 | -- | $3,874 -92.6% |
| 2002 | -- | $52,058 +2.9% |
| 2001 | -- | $50,607 +3.5% |
| 2000 | -- | $48,918 |
Find assessor info on the county website
Monthly payment
Est. payment
Payment breakdown
Explore the cost of this home by adjusting the details. Changes won't be saved.Climate risks
Neighborhood: 48039
Nearby schools
Schools provided by the listing agent
- District: East China School District
Source: MiRealSource. This data may not be complete. We recommend contacting the local school district to confirm school assignments for this home.
- $117,4003 bd1 ba1.1k sqft1016 S Belle River Ave, Marine City, MI 48039Off Market
- $216,5004 bd2 ba1.7k sqft120 Scott St, Marine City, MI 48039Off Market
- $100,400-- bd-- ba-- sqft1001 S Belle River Ave, Marine city, MI 48039Off Market
- $164,5003 bd2 ba1.8k sqft1012 S Belle River Ave, Marine City, MI 48039Off Market
Similar homes
- $160,0004 bd2 ba1.9k sqft242 N Elizabeth St, Marine City, MI 48039For Sale
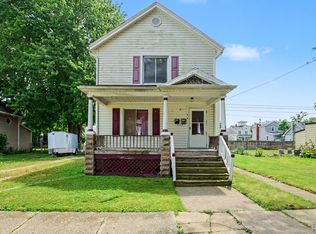
 MLS ID #20261058315, Ryan M Newman, The Agency of Gateway. Realcomp II
- $225,0003 bd1 ba988 sqft234 N Elizabeth St, Marine City, MI 48039For Sale
 MLS ID #20261087705, Steve Koleno, Beycome Brokerage Realty LLC. Realcomp II
- $199,9002 bd3 ba2.1k sqft251 Ontario Ln, Marine City, MI 48039For Sale

 MLS ID #50221855, Kristin R Gray, Town & Country Realty-Lexington. MiRealSource
- $249,5004 bd2 ba2.2k sqft421 Brown St, Marine City, MI 48039For Sale
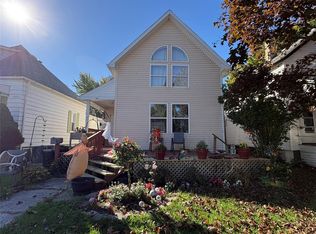 MLS ID #20261081790, Michele Murphy, Berkshire Hathaway HomeServices Kee Realty Washin. Realcomp II
- $259,9003 bd3 ba1.5k sqft154 S Market St, Marine City, MI 48039For SaleMLS ID #20261087792, Daniel H Hauer, Square Deal Homes. Realcomp II
- $190,0003 bd1 ba1k sqft7504 Meisner Rd, Casco, MI 48064For SaleMLS ID #20261086834, Crystian Segura, Century 21 Curran & Oberski. Realcomp II
- $209,9003 bd2 ba1.3k sqft1935 Saint Clair River Dr, Algonac, MI 48001For SaleMLS ID #20261090180, Mark Reling, MVPS Realtors. Realcomp II
- $179,9003 bd1 ba1.1k sqft371 Colonial Ln, Algonac, MI 48001For SaleMLS ID #50226756, Lucy A Burby, RE/MAX First. MiRealSource
- $219,9003 bd2 ba1.2k sqft351 Center St, Algonac, MI 48001For SaleMLS ID #50220936, Janis DeGregory, JD & Associates Realtors. MiRealSource
- $187,5003 bd2 ba1.4k sqft9642 Meadowbrook St, Clay, MI 48001For SaleMLS ID #50225382, Lucy A Burby, RE/MAX First. MiRealSource
- $179,9003 bd1 ba1k sqft549 Edward St, Algonac, MI 48001For SaleMLS ID #50226307, Catrina Galli, Real Estate One Clinton. MiRealSource
- $214,9002 bd1 ba1.4k sqft1401 Saint Clair Blvd, Algonac, MI 48001For SaleMLS ID #50216252, Laura Janski, RE/MAX Advisors. MiRealSource
- $199,9002 bd1 ba1.9k sqft710 Ruskin Ave, Algonac, MI 48001For SaleMLS ID #50224158, Lucy A Burby, RE/MAX First. MiRealSource
- $195,0003 bd1 ba960 sqft2185 N Channel Dr, Harsens Island, MI 48028For SaleMLS ID #20261023611, Jamie D'Luge, EXP Realty Romeo. Realcomp II
- $199,9003 bd1 ba1k sqft417 Lathrop Ave, Algonac, MI 48001For SaleMLS ID #50226809, Pamela Ceder, Sine & Monaghan Realtors LLC Algonac. MiRealSource
- $224,9003 bd2 ba1.4k sqft703 Smith St, Algonac, MI 48001For SaleMLS ID #20261086254, Sebastian Freeman, Epique Realty. Realcomp II
- $189,9003 bd1 ba1.9k sqft36831 Lakeview Ln, Richmond, MI 48062For SaleMLS ID #50227297, Richard J Landuyt, Coldwell Banker Professionals. MiRealSource
