Newly renovated. Move in ready with central AC!
Foreclosed
Est. $50,000
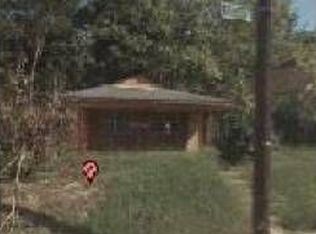
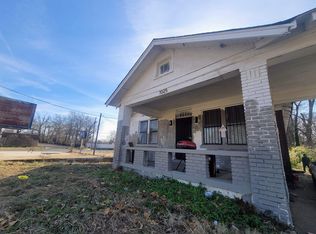
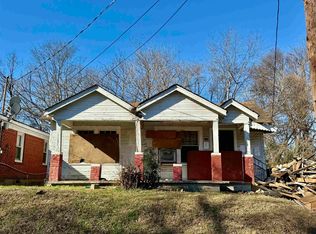
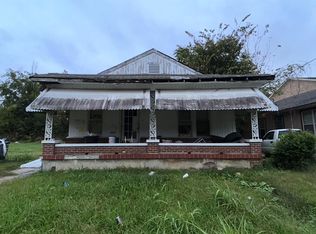
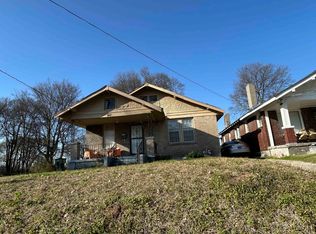
918 Decatur St, Memphis, TN 38107
2beds
1,250sqft
Single Family Residence
Built in 1910
7,405.2 Square Feet Lot
$-- Zestimate®
$40/sqft
$-- HOA
Overview
- 74 days |
- 12 |
- 0 |
Zillow last checked: 8 hours ago
Listing updated: July 14, 2023 at 08:14am
Listed by:
Patrick B Carodine,
Carodine Real Estate Firm
Source: MAAR,MLS#: 10148046
Facts & features
Interior
Bedrooms & bathrooms
- Bedrooms: 2
- Bathrooms: 1
- Full bathrooms: 1
Primary bedroom
- Area: 100
- Dimensions: 10 x 10
Bedroom 2
- Area: 81
- Dimensions: 9 x 9
Dining room
- Area: 90
- Dimensions: 9 x 10
Kitchen
- Features: Washer/Dryer Connections
Living room
- Area: 143
- Dimensions: 13 x 11
Den
- Dimensions: 0 x 0
Heating
- Ceiling
Cooling
- Central Air
Features
- All Bedrooms Down
- Basement: Crawl Space
- Has fireplace: No
Interior area
- Total interior livable area: 1,250 sqft
Property
Parking
- Parking features: Driveway/Pad
- Has uncovered spaces: Yes
Features
- Stories: 1
- Exterior features: Other (See REMARKS)
- Pool features: None
Lot
- Size: 7,405.2 Square Feet
- Dimensions: 50 x 150
- Features: Landscaped, Other (See Remarks)
Details
- Parcel number: 021044 00055
Construction
Type & style
- Home type: SingleFamily
- Architectural style: Traditional
- Property subtype: Single Family Residence
Materials
- Wood/Composition
Condition
- New construction: No
- Year built: 1910
Community & HOA
Community
- Subdivision: Toohey Blk 2
Location
- Region: Memphis
Financial & listing details
- Price per square foot: $40/sqft
- Tax assessed value: $50,000
- Annual tax amount: $356
- Price range: $50K - $50K
- Date on market: 5/16/2023
- Cumulative days on market: 20 days
- Listing terms: Conventional,FHA,VA Loan
Visit our professional directory to find a foreclosure specialist in your area that can help with your home search.
Find a foreclosure agentForeclosure details
Estimated market value
Not available
Estimated sales range
Not available
$1,068/mo
Price history
Price history
| Date | Event | Price |
|---|---|---|
| 12/18/2025 | Sold | $45,579-49.3%$36/sqft |
Source: Public Record Report a problem | ||
| 4/17/2025 | Listing removed | $89,900$72/sqft |
Source: | ||
| 2/13/2025 | Listed for sale | $89,900$72/sqft |
Source: | ||
| 1/30/2025 | Pending sale | $89,900$72/sqft |
Source: | ||
| 10/14/2024 | Price change | $89,900-14.3%$72/sqft |
Source: | ||
| 9/12/2024 | Price change | $104,900-8.7%$84/sqft |
Source: | ||
| 8/16/2024 | Listed for sale | $114,900+129.8%$92/sqft |
Source: | ||
| 7/13/2023 | Sold | $50,000+1%$40/sqft |
Source: | ||
| 5/16/2023 | Listed for sale | $49,500+725%$40/sqft |
Source: | ||
| 10/19/2009 | Sold | $6,000+42.9%$5/sqft |
Source: Public Record Report a problem | ||
| 10/16/2008 | Sold | $4,200-30%$3/sqft |
Source: Public Record Report a problem | ||
| 8/21/2008 | Price change | $6,000-25%$5/sqft |
Source: foreclosure.com Report a problem | ||
| 8/19/2008 | Listed for sale | $8,000-67.1%$6/sqft |
Source: foreclosure.com Report a problem | ||
| 4/25/2008 | Sold | $24,300-58.1%$19/sqft |
Source: Public Record Report a problem | ||
| 6/7/2006 | Sold | $58,000+185%$46/sqft |
Source: Public Record Report a problem | ||
| 8/17/2005 | Sold | $20,349$16/sqft |
Source: Public Record Report a problem | ||
Public tax history
Public tax history
| Year | Property taxes | Tax assessment |
|---|---|---|
| 2025 | $659 +71% | $12,500 +113.7% |
| 2024 | $385 +8.1% | $5,850 |
| 2023 | $356 | $5,850 |
| 2022 | -- | $5,850 +220.5% |
| 2021 | -- | $1,825 |
| 2020 | $25 | -- |
| 2019 | $25 -21.1% | $775 |
| 2018 | $31 -45.1% | $775 |
| 2017 | $57 -23.5% | $775 -64.8% |
| 2016 | $75 -22.5% | $2,200 |
| 2014 | $96 | $2,200 |
| 2013 | -- | $2,200 -27.3% |
| 2012 | -- | $3,025 |
| 2011 | -- | $3,025 |
| 2010 | -- | $3,025 -58.8% |
| 2009 | -- | $7,350 -11.2% |
| 2008 | -- | $8,275 |
| 2007 | -- | $8,275 |
| 2006 | -- | $8,275 |
| 2005 | -- | $8,275 +47.1% |
| 2004 | -- | $5,625 |
| 2003 | -- | $5,625 |
| 2002 | -- | $5,625 |
| 2001 | -- | $5,625 +55.2% |
| 2000 | -- | $3,625 |
Find assessor info on the county website
BuyAbility℠ payment
Estimated monthly payment
Boost your down payment with 6% savings match
Earn up to a 6% match & get a competitive APY with a *. Zillow has partnered with to help get you home faster.
Learn more*Terms apply. Match provided by Foyer. Account offered by Pacific West Bank, Member FDIC.Climate risks
Neighborhood: Downtown
Nearby schools
GreatSchools rating
- NACaldwell-Guthrie Elementary SchoolGrades: PK-5Distance: 0.2 mi
- NAHumes Middle SchoolGrades: 7-8Distance: 0.7 mi
- 3/10Manassas High SchoolGrades: 9-12Distance: 0.6 mi