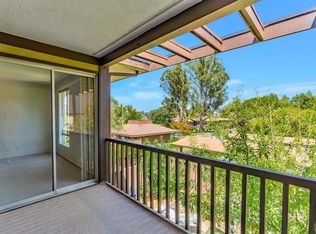
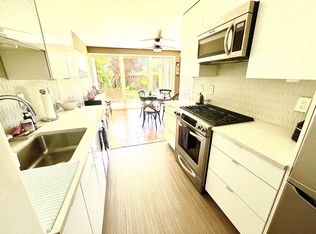
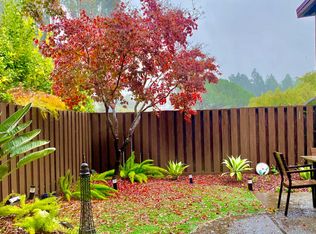
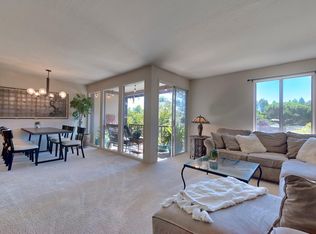
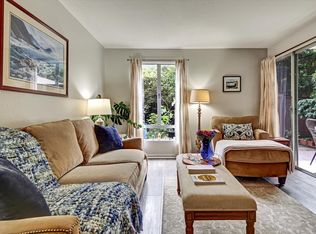
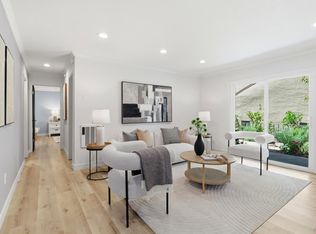
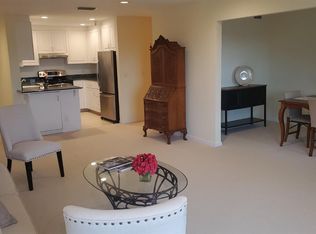
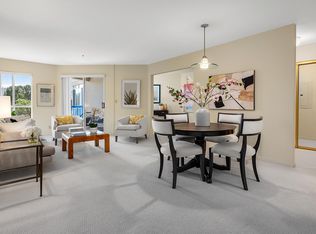
This 984 square foot condo home has 2 bedrooms and 2.0 bathrooms. This home is located at 930 Lea Dr, San Rafael, CA 94903.
Pre-foreclosure
Est. $507,200
930 Lea Dr, San Rafael, CA 94903
2beds
2baths
984sqft
Condo
Built in 1963
-- sqft lot
$507,200 Zestimate®
$515/sqft
$-- HOA
Overview
- 51 days |
- 15 |
- 2 |
Facts & features
Interior
Bedrooms & bathrooms
- Bedrooms: 2
- Bathrooms: 2
Heating
- Other
Features
- Has fireplace: Yes
Interior area
- Total interior livable area: 984 sqft
Property
Lot
- Size: 4,199 Square Feet
Details
- Parcel number: 17541105
Construction
Type & style
- Home type: Condo
- Architectural style: Colonial
Condition
- Year built: 1963
Community & HOA
Location
- Region: San Rafael
Financial & listing details
- Price per square foot: $515/sqft
- Tax assessed value: $429,032
- Annual tax amount: $7,734
Visit our professional directory to find a foreclosure specialist in your area that can help with your home search.
Find a foreclosure agentForeclosure details
Estimated market value
$507,200
$462,000 - $558,000
$2,952/mo
Price history
| Date | Event | Price |
|---|---|---|
| 11/13/2013 | Sold | $350,000+7.7%$356/sqft |
Source: Public Record Report a problem | ||
| 7/18/2013 | Listed for sale | $325,000-27.6%$330/sqft |
Source: Bradley Real Estate-San Rafael #21316076 Report a problem | ||
| 12/15/2004 | Sold | $449,000+39%$456/sqft |
Source: Public Record Report a problem | ||
| 4/10/2003 | Sold | $323,000$328/sqft |
Source: Public Record Report a problem | ||
Public tax history
| Year | Property taxes | Tax assessment |
|---|---|---|
| 2025 | $7,734 +5.7% | $429,032 +2% |
| 2024 | $7,317 +1.4% | $420,622 +2% |
| 2023 | $7,217 +4.6% | $412,376 +2% |
| 2022 | $6,896 +5.1% | $404,292 +2% |
| 2021 | $6,565 +1.1% | $396,368 +1% |
| 2020 | $6,491 +4.1% | $392,304 +2% |
| 2019 | $6,237 +1.5% | $384,614 +2% |
| 2018 | $6,142 +6.7% | $377,076 +2% |
| 2017 | $5,755 +2.5% | $369,684 +2% |
| 2016 | $5,612 +3.4% | $362,434 +1.5% |
| 2015 | $5,430 +7.3% | $356,992 +2% |
| 2014 | $5,060 | $350,000 +7.7% |
| 2013 | -- | $325,000 +1.2% |
| 2012 | -- | $321,264 -3% |
| 2011 | -- | $331,200 |
| 2010 | -- | $331,200 -23.2% |
| 2009 | -- | $431,040 -9.5% |
| 2008 | -- | $476,478 +2% |
| 2007 | -- | $467,139 +2% |
| 2006 | -- | $457,980 +2% |
| 2005 | -- | $449,000 +36.5% |
| 2004 | -- | $329,030 +379.8% |
| 2003 | -- | $68,570 +2% |
| 2002 | -- | $67,227 +2% |
| 2001 | -- | $65,909 |
Find assessor info on the county website
Monthly payment
Estimated monthly payment
All calculations are estimates and provided by Zillow, Inc. for informational purposes only. Actual amounts may vary.
HOA fees may include property taxes on listings classified as Co-Ops. Contact the listing agent and/or owner for fee details.
Mortgage interest rates are dependent on a number of factors, including credit score, down payment, and repayment length. Interest rate data provided by Zillow Group Marketplace, Inc. as of 1/1/1970 from various mortgage lenders with which we have lead or other similar arrangements; the Estimated Payment is an average of those rates.
See how much you could borrow to make a competitive offer.
Climate risks
Neighborhood: Terra Linda
Nearby schools
GreatSchools rating
- 9/10Vallecito Elementary SchoolGrades: K-5Distance: 0.7 mi
- 10/10Miller Creek Middle SchoolGrades: 6-8Distance: 1.7 mi
- 9/10Terra Linda High SchoolGrades: 9-12Distance: 0.9 mi
Nearby cities
Nearby neighborhoods
Nearby zip codes
Other San Rafael Topics
