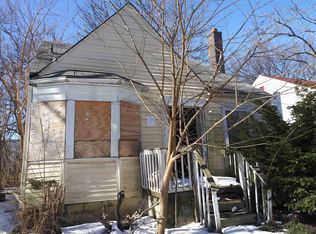
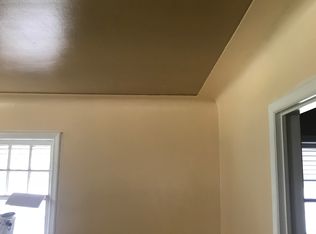
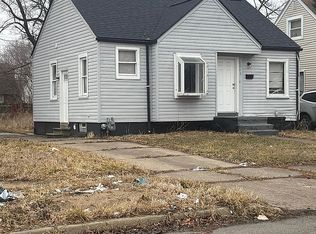
Vacant single-family home. Property features 3 bedrooms and 1 bathroom, with basement foundation. Ideal for investors or owner-occupants looking to add value. Home requires minor updates. BATVAI.
Active
Price cut: $2.6K (5/14)
$39,900
9605 Decatur St, Detroit, MI 48227
3beds
968sqft
Single Family Residence
Built in 1947
4,356 Square Feet Lot
$-- Zestimate®
$41/sqft
$-- HOA
What's special
- 203 days |
- 183 |
- 23 |
Zillow last checked:
Listing updated:
Listed by:
Kristian Freiwald 313-626-5996,
Domus Realty 313-626-5996
Source: MichRIC,MLS#: 25062167
Facts & features
Interior
Bedrooms & bathrooms
- Bedrooms: 3
- Bathrooms: 1
- Full bathrooms: 1
- Main level bedrooms: 2
Heating
- Forced Air
Appliances
- Laundry: None
Features
- Basement: Full
- Has fireplace: No
Interior area
- Total structure area: 968
- Total interior livable area: 968 sqft
- Finished area below ground: 0
Property
Features
- Stories: 2
Lot
- Size: 4,356 Square Feet
- Dimensions: 36 x 124
Details
- Parcel number: 22032353.
Construction
Type & style
- Home type: SingleFamily
- Property subtype: Single Family Residence
Materials
- Shingle Siding
Condition
- New construction: No
- Year built: 1947
Utilities & green energy
- Sewer: Public Sewer
- Water: Public
Community & HOA
Location
- Region: Detroit
Financial & listing details
- Price per square foot: $41/sqft
- Tax assessed value: $12,031
- Annual tax amount: $1,200
- Date on market: 12/17/2025
- Listing terms: Other,Cash,FHA,VA Loan,Conventional
Estimated market value
Not available
Estimated sales range
Not available
$1,214/mo
Price history
| Date | Event | Price |
|---|---|---|
| 5/14/2026 | Price change | $39,900-6.1%$41/sqft |
Source: | ||
| 5/4/2026 | Price change | $42,500-5.6%$44/sqft |
Source: | ||
| 3/31/2026 | Price change | $45,000-5.3%$46/sqft |
Source: | ||
| 12/17/2025 | Listed for sale | $47,500-13.6%$49/sqft |
Source: | ||
| 11/4/2025 | Listing removed | $55,000$57/sqft |
Source: | ||
| 7/28/2025 | Price change | $55,000-8.3%$57/sqft |
Source: | ||
| 6/18/2025 | Price change | $60,000-7.7%$62/sqft |
Source: | ||
| 6/2/2025 | Price change | $65,000-7.1%$67/sqft |
Source: | ||
| 5/12/2025 | Listed for sale | $70,000+94.4%$72/sqft |
Source: | ||
| 8/31/2022 | Listing removed | -- |
Source: Zillow Rental Network_1 Report a problem | ||
| 7/29/2022 | Listing removed | -- |
Source: | ||
| 7/28/2022 | Price change | $36,000-7.7%$37/sqft |
Source: | ||
| 7/24/2022 | Listed for rent | $1,250$1/sqft |
Source: Zillow Rental Network_1 Report a problem | ||
| 6/20/2022 | Listed for sale | $39,000-42.6%$40/sqft |
Source: | ||
| 2/22/2022 | Sold | $68,000+240%$70/sqft |
Source: Public Record Report a problem | ||
| 7/8/2010 | Sold | $19,999$21/sqft |
Source: Public Record Report a problem | ||
Public tax history
| Year | Property taxes | Tax assessment |
|---|---|---|
| 2025 | -- | $14,500 +23.9% |
| 2024 | -- | $11,700 +11.4% |
| 2023 | -- | $10,500 +19.3% |
| 2022 | -- | $8,800 +14.3% |
| 2021 | -- | $7,700 |
| 2020 | $1,096 +53% | $7,700 +35.8% |
| 2019 | $717 | $5,670 +1.3% |
| 2018 | $717 | $5,600 +3.7% |
| 2017 | -- | $5,400 -60% |
| 2016 | $2,093 | $13,500 |
| 2015 | $2,093 +10.6% | $13,500 -28.6% |
| 2013 | $1,892 -9.6% | $18,916 -30.2% |
| 2010 | $2,093 | $27,103 -12% |
| 2009 | -- | $30,799 -13.5% |
| 2008 | -- | $35,606 |
| 2007 | -- | $35,606 +5.5% |
| 2005 | $283 | $33,750 +3% |
| 2004 | -- | $32,767 +55.3% |
| 2001 | $1,757 +284.2% | $21,100 +176.1% |
| 2000 | $457 | $7,642 |
Find assessor info on the county website
Monthly payment
Est. payment$--/mo
Payment breakdown
Explore the cost of this home by adjusting the details. Changes won't be saved.All calculations are estimates and provided by Zillow, Inc. for informational purposes only. Actual amounts may vary.
HOA fees may include property taxes on listings classified as Co-Ops. Contact the listing agent and/or owner for fee details.
Mortgage interest rates are dependent on a number of factors, including credit score, down payment, and repayment length. Interest rate data provided by Zillow Group Marketplace, Inc. as of 1/1/1970 from various mortgage lenders with which we have lead or other similar arrangements; the Estimated Payment is an average of those rates.
See how much you could borrow to make a competitive offer.
Climate risks
Neighborhood: Plymouth-Hubbell
Nearby schools
GreatSchools rating
- 3/10Mackenzie Elementary-Middle SchoolGrades: PK-8Distance: 1.1 mi
- 3/10Cody High SchoolGrades: 9-12Distance: 2.1 mi
A local agent can set up tours, give advice and negotiate with sellers.


- Michigan
- Wayne County
- Detroit
- 48227
- Plymouth-Hubbell
- 9605 Decatur St
Nearby cities
Nearby neighborhoods
Nearby zip codes
Other Detroit Topics
