This 2-bedroom, 1-bathroom single-family residence in Belding offers nearly an acre of land—1 square foot shy of a full acre—providing substantial outdoor space and privacy for your investment. The generous lot size creates opportunity for expansion, recreation, or future development while maintaining the character of owning a standalone home. Sellers reserve the right to call Highest & Best.
Pending
$139,900
9890 Fish Rd, Belding, MI 48809
2beds
1,148sqft
Single Family Residence
Built in 1920
1 Acres Lot
$138,500 Zestimate®
$122/sqft
$-- HOA
What's special
Generous lot sizeSubstantial outdoor space
- 25 days
- 1,237
- 80
Zillow last checked:
Listing updated:
Listed by:
Mary B Buckius 616-345-3620,
Keller Williams GR North 616-447-9100,
Steven A Pettit 616-504-6674,
Keller Williams GR North
Source: MichRIC,MLS#: 26052233
Facts & features
Interior
Bedrooms & bathrooms
- Bedrooms: 2
- Bathrooms: 1
- Full bathrooms: 1
- Main level bedrooms: 2
Heating
- Forced Air
Appliances
- Included: Dryer, Microwave, Range, Refrigerator, Washer
- Laundry: Main Level
Features
- Flooring: Wood
- Basement: Slab
- Has fireplace: No
Interior area
- Total structure area: 1,148
- Total interior livable area: 1,148 sqft
Property
Features
- Stories: 1
Lot
- Size: 1 Acres
- Dimensions: 165 x 264
Details
- Parcel number: 3413001600016000
Construction
Type & style
- Home type: SingleFamily
- Architectural style: Ranch
- Property subtype: Single Family Residence
Materials
- Aluminum Siding
- Roof: Shingle
Condition
- New construction: No
- Year built: 1920
Utilities & green energy
- Sewer: Septic Tank
- Water: Well
Community & HOA
Location
- Region: Belding
Financial & listing details
- Price per square foot: $122/sqft
- Tax assessed value: $32,067
- Annual tax amount: $955
- Date on market: 10/1/2026
- Listing terms: Cash,Conventional
- Road surface type: Unimproved
Estimated market value
$138,500
$132,000 - $145,000
$1,361/mo
Price history
| Date | Event | Price |
|---|---|---|
| 10/8/2026 | Pending sale | $139,900$122/sqft |
Source:  MichRIC #26052233 Report a problem | ||
| 10/1/2026 | Listed for sale | $139,900+192.1%$122/sqft |
Source: MichRIC #26052233 Report a problem | ||
| 5/6/2015 | Sold | $47,900$42/sqft |
Source: MichRIC #14055716 Report a problem | ||
| 10/24/2014 | Price change | $47,900-4%$42/sqft |
Source: Hanson Real Estate Group #14055716 Report a problem | ||
| 10/2/2014 | Listed for sale | $49,900+78.2%$43/sqft |
Source: Hanson Real Estate Group #14055716 Report a problem | ||
| 11/16/2012 | Sold | $28,000-6.4%$24/sqft |
Source: MichRIC #12028688 Report a problem | ||
| 8/7/2012 | Price change | $29,900-14.6%$26/sqft |
Source: LER Holdings Inc. #12028688 Report a problem | ||
| 5/24/2012 | Listed for sale | $35,000$30/sqft |
Source: LER Holdings Inc. #12028688 Report a problem | ||
Public tax history
| Year | Property taxes | Tax assessment |
|---|---|---|
| 2025 | $926 +4.6% | $49,100 +3.8% |
| 2024 | $885 | $47,300 +16.2% |
| 2023 | -- | $40,700 +13.4% |
| 2022 | -- | $35,900 |
| 2021 | -- | $35,900 -0.6% |
| 2020 | -- | $36,100 +9.7% |
| 2019 | -- | $32,900 +25.1% |
| 2018 | -- | $26,300 |
| 2017 | -- | $26,300 +11.4% |
| 2016 | -- | $23,600 |
| 2015 | -- | $23,600 -5.6% |
| 2014 | $165 | $25,000 -11% |
| 2013 | -- | $28,100 |
| 2012 | -- | $28,100 -1.7% |
| 2011 | -- | $28,600 +11.7% |
| 2010 | -- | $25,600 -4.8% |
| 2009 | -- | $26,893 -4% |
| 2008 | -- | $28,001 -7.2% |
| 2007 | -- | $30,165 +6.6% |
| 2006 | -- | $28,300 +4% |
| 2005 | -- | $27,200 +11.5% |
| 2004 | -- | $24,400 -5.4% |
| 2003 | -- | $25,800 |
Find assessor info on the county website
Monthly payment
Est. payment
Payment breakdown
Explore the cost of this home by adjusting the details. Changes won't be saved.Climate risks
Neighborhood: 48809


Similar homes
- $119,0003 bd2 ba1.1k sqft7811 River Rd, Belding, MI 48809For Sale By Owner
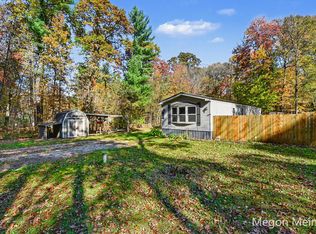
- $125,0003 bd2 ba1k sqft8320 Bradley Rd, Belding, MI 48809For Sale
 MLS ID #26056478, Megon Meinke, Five Star Real Estate (Courtland). MichRIC
- $175,0004 bd2 ba1.5k sqft117 E Washington St, Belding, MI 48809For Sale
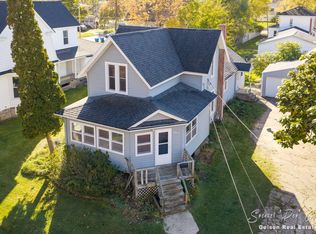 MLS ID #26056492, Spencer J Geisen, Five Star Real Estate (E. Division). MichRIC
- $--3 bd1 ba873 sqft821 E Pearl St, Greenville, MI 48838AuctionAuction.com 2
- $159,9003 bd1 ba988 sqft721 Pearl St, Belding, MI 48809For SaleMLS ID #26035838, John H Schlundt-Bodien, Greenridge Realty (Summit). MichRIC
- $195,0003 bd1 ba1.4k sqft319 Interstate Highway O St, Belding, MI 48809For SaleMLS ID #26054852, Spencer J Geisen, Five Star Real Estate (E. Division). MichRIC
- $139,9002 bd1 ba624 sqft919 W Grove St, Greenville, MI 48838For SaleMLS ID #26053676, Tori L Ensing, Five Star Real Estate (Greenv). MichRIC
- $119,9002 bd1 ba1.6k sqft187 W Ferney St, Clarksville, MI 48815For SaleMLS ID #26056521, Taylor Macias, Keller Williams GR East. MichRIC
- $204,9003 bd2 ba1.1k sqft121 E Isabelle St, Belding, MI 48809For SaleMLS ID #26045608, Brent T Cox, West Urban Realty LLC. MichRIC
- $179,9003 bd1 ba1.4k sqft412 N Smith St, Greenville, MI 48838For SaleMLS ID #26056453, Alexis Clark, Keller Williams GR East. MichRIC
- $124,0002 bd1 ba958 sqft311 N State St, Ionia, MI 48846For Sale
 MLS ID #50224962, Scott Fader, Joseph Walter Realty LLC. MiRealSource
- $149,9002 bd1 ba1.5k sqft4685 W Fritz Rd, Stanton, MI 48888For SaleMLS ID #26038925, Christopher M Bruce, Keller Williams GR East. MichRIC
- $118,9003 bd1 ba1.4k sqft725 W Lincoln Ave, Ionia, MI 48846For SaleMLS ID #50223514, Justin Ferullo, Keller Williams Preferred. MiRealSource
- $193,5003 bd2 ba1.1k sqft8024 Scott Rd, Saranac, MI 48881For SaleMLS ID #26051167, Ryan D Hesche, Greenridge Realty (Saranac). MichRIC
- $175,0003 bd1 ba960 sqft2648 Walnut Dr, Ionia, MI 48846For SaleMLS ID #26049869, Hope M Gallup, Greenridge Realty (Ionia). MichRIC
