$278,500
3 bd|2 ba|638 sqft
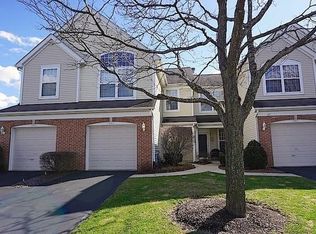
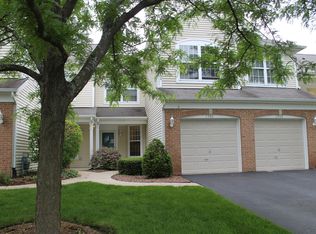
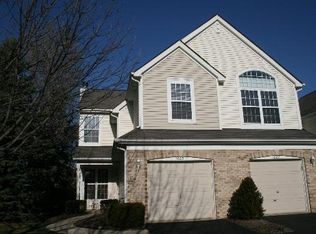
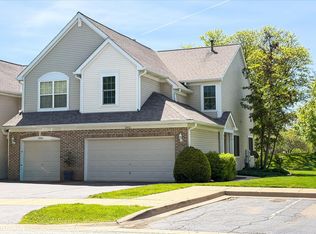
2962 Waters Edge Cir #3, Aurora, IL 60504
Off Market
Zillow last checked:
Listing updated:
Kusum Malhotra 630-881-3724,
Charles Rutenberg Realty of IL
Not available
Estimated sales range
Not available
Not available
| Date | Event | Price |
|---|---|---|
| 6/7/2026 | Listed for sale | $305,000+112.5%$218/sqft |
Source: | ||
| 3/18/2025 | Listing removed | $2,400$2/sqft |
Source: MRED as distributed by MLS GRID #12280136 Report a problem | ||
| 3/6/2025 | Listed for rent | $2,400$2/sqft |
Source: MRED as distributed by MLS GRID #12280136 Report a problem | ||
| 2/11/2025 | Listing removed | $2,400$2/sqft |
Source: MRED as distributed by MLS GRID #12280136 Report a problem | ||
| 2/5/2025 | Listed for rent | $2,400$2/sqft |
Source: MRED as distributed by MLS GRID #12280136 Report a problem | ||
| 8/26/2016 | Sold | $143,500-10.3%$103/sqft |
Source: | ||
| 7/29/2016 | Pending sale | $160,000$114/sqft |
Source: Kirch Property Management #09243609 Report a problem | ||
| 6/15/2016 | Price change | $160,000-5.8%$114/sqft |
Source: Kirch Property Management #09243609 Report a problem | ||
| 6/1/2016 | Listed for sale | $169,900+57.3%$121/sqft |
Source: Kirch Property Management #09243609 Report a problem | ||
| 1/11/1999 | Sold | $108,000-22.9%$77/sqft |
Source: Public Record Report a problem | ||
| 5/26/1995 | Sold | $140,000$100/sqft |
Source: Public Record Report a problem | ||
| Year | Property taxes | Tax assessment |
|---|---|---|
| 2024 | $5,917 +4.1% | $77,825 +11.3% |
| 2023 | $5,683 +3.9% | $69,930 +7.2% |
| 2022 | $5,472 +2.5% | $65,250 +3.7% |
| 2021 | $5,338 -1.2% | $62,920 |
| 2020 | $5,403 +3.4% | $62,920 +5.1% |
| 2019 | $5,228 +14.8% | $59,840 +16.1% |
| 2018 | $4,552 +1.5% | $51,540 +3.5% |
| 2017 | $4,486 +16.1% | $49,790 +4.2% |
| 2016 | $3,864 +1.5% | $47,790 +5.3% |
| 2015 | $3,808 +10.9% | $45,370 +12.1% |
| 2014 | $3,433 +1% | $40,460 -0.7% |
| 2013 | $3,400 -23.7% | $40,740 -24.6% |
| 2012 | $4,458 +2.1% | $54,000 -6.4% |
| 2011 | $4,366 -0.6% | $57,710 -5.6% |
| 2010 | $4,391 +2.9% | $61,130 -4% |
| 2009 | $4,268 +2.7% | $63,680 +1.8% |
| 2008 | $4,156 +4.2% | $62,550 +5.8% |
| 2007 | $3,987 +1.6% | $59,120 +3.7% |
| 2006 | $3,925 +2% | $56,990 +4.6% |
| 2005 | $3,850 +4.2% | $54,460 +3.8% |
| 2004 | $3,693 +2.2% | $52,470 +6.8% |
| 2003 | $3,615 +1.6% | $49,130 +1.2% |
| 2002 | $3,557 +4.5% | $48,570 +4.7% |
| 2001 | $3,404 +5.8% | $46,390 +4.4% |
| 2000 | $3,217 | $44,430 |
Source: MRED as distributed by MLS GRID. This data may not be complete. We recommend contacting the local school district to confirm school assignments for this home.
A local agent can set up tours, give advice and negotiate with sellers.
A local lender can help you make sure your offer is ready when you are.