$394,600
4 bd|2 ba|1.1k sqft
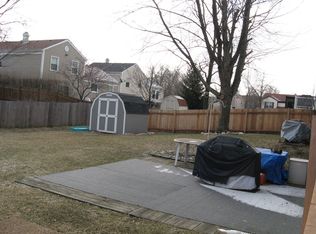
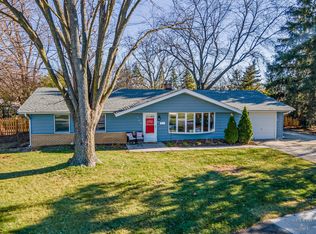
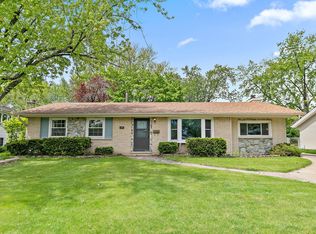
828 Grant St, Bartlett, IL 60103
Off Market
Zillow last checked:
Listing updated:
Sean Gimpert 630-217-7897,
O'Neil Property Group, LLC
Not available
Estimated sales range
Not available
Not available
| Date | Event | Price |
|---|---|---|
| 6/11/2026 | Listed for sale | $399,000+125.4%$262/sqft |
Source: | ||
| 5/12/2017 | Sold | $177,000-6.8%$116/sqft |
Source: | ||
| 12/23/2016 | Pending sale | $189,900$125/sqft |
Source: Berkshire Hathaway HomeServices KoenigRubloff Realty Group #09402935 Report a problem | ||
| 12/11/2016 | Listed for sale | $189,900$125/sqft |
Source: Berkshire Hathaway HomeServices KoenigRubloff #09402935 Report a problem | ||
| 10/26/2016 | Listing removed | $189,900$125/sqft |
Source: RE/MAX All Pro #09222810 Report a problem | ||
| 10/6/2016 | Price change | $189,900-5%$125/sqft |
Source: RE/MAX All Pro #09222810 Report a problem | ||
| 9/12/2016 | Price change | $199,900-2.4%$131/sqft |
Source: RE/MAX All Pro #09222810 Report a problem | ||
| 8/16/2016 | Price change | $204,900-4.3%$134/sqft |
Source: RE/MAX All Pro #09222810 Report a problem | ||
| 7/27/2016 | Price change | $214,000-2.7%$140/sqft |
Source: RE/MAX All Pro #09222810 Report a problem | ||
| 6/27/2016 | Price change | $219,900-4.3%$144/sqft |
Source: RE/MAX All Pro #09222810 Report a problem | ||
| 6/15/2016 | Price change | $229,900-4.2%$151/sqft |
Source: RE/MAX All Pro #09222810 Report a problem | ||
| 6/3/2016 | Price change | $239,900-4%$157/sqft |
Source: RE/MAX All Pro #09222810 Report a problem | ||
| 5/11/2016 | Listed for sale | $249,900+52.4%$164/sqft |
Source: RE/MAX All Pro #09222810 Report a problem | ||
| 4/19/2000 | Sold | $164,000$108/sqft |
Source: Public Record Report a problem | ||
| Year | Property taxes | Tax assessment |
|---|---|---|
| 2024 | $8,354 +9% | $111,322 +10.2% |
| 2023 | $7,665 -0.2% | $101,000 +7.6% |
| 2022 | $7,678 +3% | $93,870 +5.3% |
| 2021 | $7,455 +2.5% | $89,110 +3.1% |
| 2020 | $7,272 +1.4% | $86,440 +3.7% |
| 2019 | $7,171 +35.2% | $83,360 +35.7% |
| 2018 | $5,302 +3.1% | $61,450 +4.2% |
| 2017 | $5,142 -20% | $59,000 -16.1% |
| 2016 | $6,424 +5.9% | $70,280 +10.9% |
| 2015 | $6,067 +11.7% | $63,350 +6.1% |
| 2014 | $5,433 -16.7% | $59,710 -2.3% |
| 2013 | $6,525 +5.6% | $61,140 -8.9% |
| 2012 | $6,177 +6.2% | $67,140 -7.6% |
| 2011 | $5,819 -1% | $72,630 -12.7% |
| 2010 | $5,876 -0.4% | $83,190 -6.4% |
| 2009 | $5,899 +6.2% | $88,880 |
| 2008 | $5,556 +4% | $88,880 +5% |
| 2007 | $5,344 +2.5% | $84,650 +10.4% |
| 2006 | $5,213 +8.5% | $76,670 +5.2% |
| 2005 | $4,802 +11% | $72,880 +11.1% |
| 2004 | $4,327 +4.7% | $65,580 +8.1% |
| 2003 | $4,133 +5.2% | $60,660 +8% |
| 2002 | $3,927 | $56,160 |
Source: MRED as distributed by MLS GRID. This data may not be complete. We recommend contacting the local school district to confirm school assignments for this home.
A local agent can set up tours, give advice and negotiate with sellers.
A local lender can help you make sure your offer is ready when you are.