$166,600
-- bd|1 ba|1.3k sqft
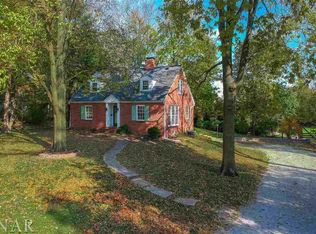
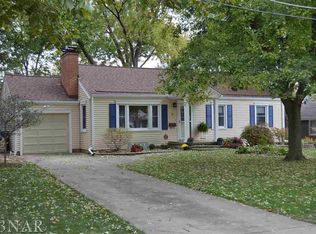
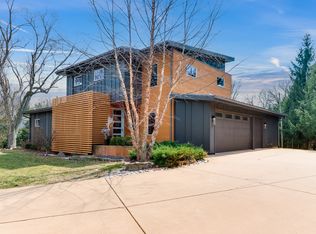
9 Norbloom Ave, Bloomington, IL 61701
Off Market
Zillow last checked:
Listing updated:
Melissa Sorensen 309-261-4081,
RE/MAX Rising
Not available
Estimated sales range
Not available
Not available
| Date | Event | Price |
|---|---|---|
| 6/4/2026 | Listed for sale | $2,600,000+4%$277/sqft |
Source: | ||
| 11/3/2022 | Listing removed | -- |
Source: | ||
| 10/13/2022 | Listed for sale | $2,500,000$267/sqft |
Source: | ||
| 10/2/2022 | Listing removed | -- |
Source: | ||
| 3/28/2022 | Listed for sale | $2,500,000$267/sqft |
Source: | ||
| Year | Property taxes | Tax assessment |
|---|---|---|
| 2024 | $32,596 +2.3% | $402,025 +5.4% |
| 2023 | $31,878 +5.3% | $381,404 +7.1% |
| 2022 | $30,265 +9.2% | $356,105 +9.2% |
| 2021 | $27,705 | $325,994 |
| 2020 | -- | $325,994 |
| 2019 | -- | $325,994 |
| 2018 | $27,436 | $325,994 |
| 2017 | $27,436 +1.8% | $325,994 -2.1% |
| 2016 | $26,940 +2.7% | $332,987 +4.4% |
| 2015 | $26,232 | $319,014 |
| 2014 | $26,232 +5% | $319,014 |
| 2013 | $24,993 -2.4% | $319,014 -3.6% |
| 2012 | $25,602 | $330,800 -0.8% |
| 2011 | $25,602 +0.4% | $333,333 |
| 2010 | $25,511 -9.6% | $333,333 -10.1% |
| 2009 | $28,227 +8.2% | $370,617 +6.9% |
| 2008 | $26,086 +2.8% | $346,672 +2.5% |
| 2007 | $25,378 | $338,052 +1.5% |
| 2006 | -- | $333,023 +258% |
| 2005 | -- | $93,012 +52.8% |
| 2002 | -- | $60,858 +4.1% |
| 2001 | -- | $58,450 +4.6% |
| 2000 | -- | $55,874 |
Source: MRED as distributed by MLS GRID. This data may not be complete. We recommend contacting the local school district to confirm school assignments for this home.
A local agent can set up tours, give advice and negotiate with sellers.
A local lender can help you make sure your offer is ready when you are.