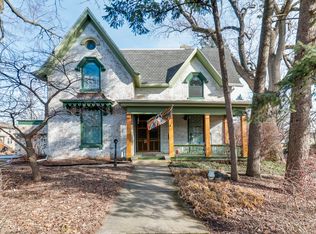
$140,900
3 bd|2 ba|1.4k sqft
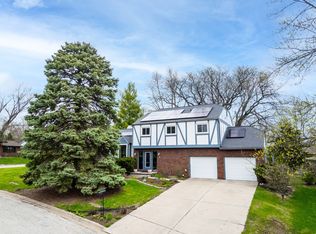
808 E Olive St, Bloomington, IL 61701
Off Market
Zillow last checked:
Listing updated:
Becky Gerig, ABR,CRS 309-212-4120,
RE/MAX Choice
$315,800
$300,000 - $332,000
$1,979/mo
| Date | Event | Price |
|---|---|---|
| 4/14/2026 | Listed for sale | $324,900+170.8%$108/sqft |
Source: | ||
| 6/11/2025 | Sold | $120,000-7.6%$40/sqft |
Source: | ||
| 5/8/2025 | Pending sale | $129,900$43/sqft |
Source: | ||
| 5/7/2025 | Listed for sale | $129,900$43/sqft |
Source: | ||
| Year | Property taxes | Tax assessment |
|---|---|---|
| 2024 | $4,271 +10.3% | $52,672 +13.7% |
| 2023 | $3,873 +5.5% | $46,336 +7.3% |
| 2022 | $3,672 +5.5% | $43,201 +5.5% |
| 2021 | $3,479 | $40,932 +1.2% |
| 2020 | -- | $40,447 |
| 2019 | -- | $40,447 |
| 2018 | $2,478 | $40,447 |
| 2017 | $2,478 0% | $40,447 -2.1% |
| 2016 | $2,479 +233.9% | $41,315 +2.3% |
| 2015 | $743 | $40,367 +5.1% |
| 2014 | $743 +5% | $38,421 +2% |
| 2013 | $707 -8.3% | $37,668 -1.1% |
| 2012 | $771 | $38,083 -8.7% |
| 2011 | $771 +0.4% | $41,712 |
| 2010 | $768 -68.7% | $41,712 |
| 2009 | $2,455 +13.8% | $41,712 +10.6% |
| 2008 | $2,157 +149.2% | $37,715 +2.6% |
| 2007 | $866 | $36,777 +2.5% |
| 2006 | -- | $35,871 +2.1% |
| 2005 | -- | $35,133 +36.6% |
| 2002 | -- | $25,718 +4.1% |
| 2001 | -- | $24,700 +4.6% |
| 2000 | -- | $23,612 |
Source: MRED as distributed by MLS GRID. This data may not be complete. We recommend contacting the local school district to confirm school assignments for this home.
A local agent can set up tours, give advice and negotiate with sellers.
A local lender can help you make sure your offer is ready when you are.