$448,100
-- bd|3 ba|747 sqft
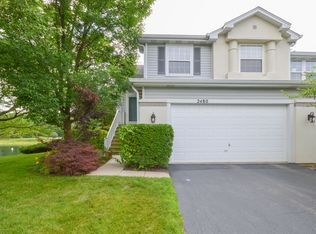
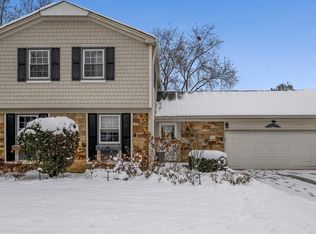
2468 Palazzo Ct, Buffalo Grove, IL 60089
Off Market
Zillow last checked: 8 hours ago
Listing updated: 13 hours ago
Winfield Cohen 847-772-8453,
Keller Williams Success Realty
$488,900
$464,000 - $513,000
$2,924/mo
| Date | Event | Price |
|---|---|---|
| 2/23/2026 | Listed for sale | $500,000$206/sqft |
Source: | ||
| 1/28/2026 | Listing removed | $500,000$206/sqft |
Source: | ||
| 1/1/2026 | Listing removed | $3,600$1/sqft |
Source: MRED as distributed by MLS GRID #12456783 Report a problem | ||
| 12/6/2025 | Listed for sale | $500,000+58.7%$206/sqft |
Source: | ||
| 8/27/2025 | Listed for rent | $3,600$1/sqft |
Source: MRED as distributed by MLS GRID #12456783 Report a problem | ||
| 4/18/2017 | Sold | $315,000-1.5%$129/sqft |
Source: | ||
| 2/27/2017 | Pending sale | $319,900$131/sqft |
Source: A Team Realty Inc. #09403143 Report a problem | ||
| 2/8/2017 | Price change | $319,900-4.2%$131/sqft |
Source: A Team Realty Inc. #09403143 Report a problem | ||
| 1/10/2017 | Price change | $333,900-5.7%$137/sqft |
Source: A Team Realty Inc. #09403143 Report a problem | ||
| 12/11/2016 | Listed for sale | $353,900-8.3%$145/sqft |
Source: Homepath Report a problem | ||
| 5/12/2008 | Listing removed | $385,900$159/sqft |
Source: Visual Tour #06688794 Report a problem | ||
| 4/16/2008 | Listed for sale | $385,900+10.3%$159/sqft |
Source: Visual Tour #06688794 Report a problem | ||
| 7/5/2006 | Sold | $350,000+5.4%$144/sqft |
Source: Public Record Report a problem | ||
| 8/4/2004 | Sold | $332,000+7.3%$136/sqft |
Source: Public Record Report a problem | ||
| 4/3/2003 | Sold | $309,500+29%$127/sqft |
Source: Public Record Report a problem | ||
| 3/3/2000 | Sold | $240,000+4.3%$99/sqft |
Source: Public Record Report a problem | ||
| 5/12/1998 | Sold | $230,000+2.2%$95/sqft |
Source: Public Record Report a problem | ||
| 6/3/1996 | Sold | $225,000$92/sqft |
Source: Public Record Report a problem | ||
| Year | Property taxes | Tax assessment |
|---|---|---|
| 2023 | $11,104 +2.9% | $132,713 +6% |
| 2022 | $10,786 +3.6% | $125,224 +3.4% |
| 2021 | $10,406 +2.3% | $121,104 +0.7% |
| 2020 | $10,176 +2.6% | $120,207 +0.4% |
| 2019 | $9,919 +2.4% | $119,764 -1.4% |
| 2018 | $9,686 | $121,450 +2.4% |
| 2017 | $9,686 +6.3% | $118,615 +4.4% |
| 2016 | $9,109 +3.7% | $113,583 +6.9% |
| 2015 | $8,785 +2.3% | $106,221 +6.2% |
| 2014 | $8,588 +0.2% | $100,065 -2.7% |
| 2012 | $8,569 +7.8% | $102,859 -13.1% |
| 2011 | $7,949 +25.6% | $118,419 +21.7% |
| 2010 | $6,330 -2.8% | $97,315 -25.5% |
| 2009 | $6,509 -15.5% | $130,573 +5.8% |
| 2008 | $7,705 +7.3% | $123,392 +5.2% |
| 2006 | $7,182 +12% | $117,334 |
| 2005 | $6,411 +6.9% | -- |
| 2004 | $5,999 +2.1% | -- |
| 2003 | $5,876 +8.7% | -- |
| 2002 | $5,405 +5.5% | -- |
| 2001 | $5,125 +5.8% | $86,512 +8.7% |
| 2000 | $4,845 | $79,590 |
Source: MRED as distributed by MLS GRID. This data may not be complete. We recommend contacting the local school district to confirm school assignments for this home.