$78,300
2 bd|2 ba|900 sqft
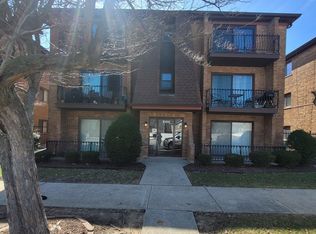
2614 E Goodrich Ave APT 3B, Burnham, IL 60633
Off Market
Zillow last checked: 7 hours ago
Listing updated: 21 hours ago
Chareda Carter 773-910-1272,
O'ANIF Real Estate & Development
$93,700
$81,000 - $107,000
$1,881/mo
| Date | Event | Price |
|---|---|---|
| 3/26/2026 | Listed for sale | $114,900-4.2%$125/sqft |
Source: | ||
| 5/22/2025 | Listing removed | $119,900$131/sqft |
Source: | ||
| 5/12/2025 | Listed for sale | $119,900+4.3%$131/sqft |
Source: | ||
| 5/5/2025 | Listing removed | $115,000$126/sqft |
Source: | ||
| 4/9/2025 | Listed for sale | $115,000+10852.4%$126/sqft |
Source: | ||
| 10/7/2017 | Listing removed | $1,100$1/sqft |
Source: Universal Holdings & Exclusive Brokerage Inc. #09728565 Report a problem | ||
| 8/22/2017 | Price change | $1,100+4.8%$1/sqft |
Source: Universal Holdings & Exclusive Brokerage Inc. #09728565 Report a problem | ||
| 11/4/2015 | Listing removed | $1,050$1/sqft |
Source: Universal Holdings & Exclusive Brokerage Inc. #08934897 Report a problem | ||
| 10/3/2015 | Pending sale | $1,050$1/sqft |
Source: Universal Holdings & Exclusive Brokerage Inc. #08934897 Report a problem | ||
| 10/3/2015 | Listed for sale | $1,050$1/sqft |
Source: Universal Holdings & Exclusive Brokerage Inc. #08934897 Report a problem | ||
| 7/22/2015 | Listing removed | $1,050$1/sqft |
Source: Universal Holdings & Exclusive Brokerage Inc. #08934897 Report a problem | ||
| 7/9/2015 | Pending sale | $1,050-98.9%$1/sqft |
Source: Universal Holdings & Exclusive Brokerage Inc. #08934897 Report a problem | ||
| 5/29/2015 | Listed for rent | $1,050$1/sqft |
Source: Universal Holdings & Exclusive Brokerage Inc. #08934897 Report a problem | ||
| 1/2/2004 | Sold | $94,000$103/sqft |
Source: Public Record Report a problem | ||
| Year | Property taxes | Tax assessment |
|---|---|---|
| 2023 | $5,229 +90.1% | $8,299 +137.2% |
| 2022 | $2,751 +2084.6% | $3,498 |
| 2021 | $126 -55.2% | $3,498 |
| 2020 | $281 | $3,498 +11.4% |
| 2019 | -- | $3,140 |
| 2018 | -- | $3,140 |
| 2017 | -- | $3,140 -41.3% |
| 2016 | $1,766 +9.5% | $5,346 |
| 2015 | $1,612 -57.8% | $5,346 -37.2% |
| 2014 | $3,817 +41.7% | $8,509 +7.6% |
| 2013 | $2,694 +1.8% | $7,905 |
| 2012 | $2,645 +0.3% | $7,905 |
| 2011 | $2,637 -8.2% | $7,905 -23.1% |
| 2010 | $2,873 +12.2% | $10,280 |
| 2009 | $2,562 +14.1% | $10,280 -5% |
| 2008 | $2,244 +1.8% | $10,820 +15.3% |
| 2007 | $2,204 +6.6% | $9,388 |
| 2006 | $2,067 +10.8% | $9,388 |
| 2005 | $1,866 -23.7% | $9,388 +14.2% |
| 2004 | $2,446 +34.4% | $8,219 |
| 2003 | $1,820 +5.8% | $8,219 |
| 2002 | $1,721 +17.5% | $8,219 +10.3% |
| 2001 | $1,464 +1.1% | $7,454 |
| 2000 | $1,448 +7.1% | $7,454 |
| 1999 | $1,352 | $7,454 |
Source: MRED as distributed by MLS GRID. This data may not be complete. We recommend contacting the local school district to confirm school assignments for this home.