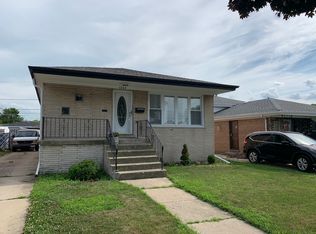
$170,500
3 bd|1 ba|1.3k sqft
1251 Memorial Dr, Calumet City, IL 60409
Off Market
Zillow last checked:
Listing updated:
Kenneth Battle 312-203-5220,
Kenneth Battle
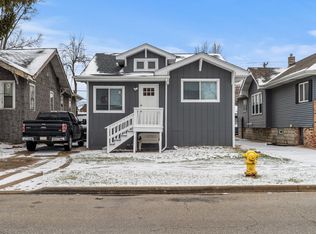
$262,700
$250,000 - $276,000
$2,312/mo
| Date | Event | Price |
|---|---|---|
| 5/20/2026 | Listing removed | $264,900$203/sqft |
Source: | ||
| 5/19/2026 | Contingent | $264,900$203/sqft |
Source: | ||
| 4/27/2026 | Price change | $264,900-1.9%$203/sqft |
Source: | ||
| 11/14/2025 | Listed for sale | $269,900+92.8%$206/sqft |
Source: | ||
| 5/12/2025 | Sold | $140,000$107/sqft |
Source: Public Record Report a problem | ||
| 3/6/2025 | Sold | $140,000$107/sqft |
Source: | ||
| 2/26/2025 | Contingent | $140,000$107/sqft |
Source: | ||
| 2/20/2025 | Listed for sale | $140,000$107/sqft |
Source: | ||
| 1/29/2025 | Contingent | $140,000$107/sqft |
Source: | ||
| 1/23/2025 | Listed for sale | $140,000+308.8%$107/sqft |
Source: | ||
| 5/21/2014 | Sold | $34,250+242.5%$26/sqft |
Source: | ||
| 3/20/2014 | Price change | $10,000-79.1%$8/sqft |
Source: Auction.com Report a problem | ||
| 3/7/2014 | Price change | $47,900-4%$37/sqft |
Source: Homepath #08395623 Report a problem | ||
| 2/8/2014 | Price change | $49,900-10.9%$38/sqft |
Source: Homepath #08395623 Report a problem | ||
| 12/31/2013 | Price change | $56,000-8%$43/sqft |
Source: Homepath #08395623 Report a problem | ||
| 11/26/2013 | Price change | $60,900-6.2%$47/sqft |
Source: Homepath #08395623 Report a problem | ||
| 9/14/2013 | Price change | $64,900-7.2%$50/sqft |
Source: Homepath #08395623 Report a problem | ||
| 8/16/2013 | Price change | $69,900-9.1%$53/sqft |
Source: Homepath #08395623 Report a problem | ||
| 7/16/2013 | Listed for sale | $76,900-54.8%$59/sqft |
Source: Homepath #08395623 Report a problem | ||
| 5/3/2006 | Sold | $170,000+47.8%$130/sqft |
Source: Public Record Report a problem | ||
| 6/8/1999 | Sold | $115,000$88/sqft |
Source: Public Record Report a problem | ||
| Year | Property taxes | Tax assessment |
|---|---|---|
| 2023 | $10,309 +5.5% | $16,000 +32% |
| 2022 | $9,769 +4% | $12,120 |
| 2021 | $9,397 +6.7% | $12,120 |
| 2020 | $8,811 +23.3% | $12,120 +29.6% |
| 2019 | $7,145 +2.1% | $9,351 |
| 2018 | $6,998 +3.5% | $9,351 |
| 2017 | $6,763 -8.5% | $9,351 -16.2% |
| 2016 | $7,390 +1.8% | $11,156 |
| 2015 | $7,260 +19.3% | $11,156 |
| 2014 | $6,086 +6.7% | $11,156 -10.6% |
| 2013 | $5,702 +4.8% | $12,477 |
| 2012 | $5,440 +3.1% | $12,477 |
| 2011 | $5,279 -6.3% | $12,477 -16% |
| 2010 | $5,635 +4.7% | $14,856 |
| 2009 | $5,382 +15.8% | $14,856 -5% |
| 2008 | $4,649 +6.6% | $15,637 +6.9% |
| 2007 | $4,360 -6.2% | $14,623 |
| 2006 | $4,650 +38.1% | $14,623 |
| 2005 | $3,366 +0.4% | $14,623 +15.6% |
| 2004 | $3,353 +2.5% | $12,649 |
| 2003 | $3,270 +7.3% | $12,649 |
| 2002 | $3,046 +20.9% | $12,649 +11.9% |
| 2001 | $2,520 +2.6% | $11,306 |
| 2000 | $2,457 +10.1% | $11,306 |
| 1999 | $2,231 | $11,306 |
Source: MRED as distributed by MLS GRID. This data may not be complete. We recommend contacting the local school district to confirm school assignments for this home.
A local agent can set up tours, give advice and negotiate with sellers.