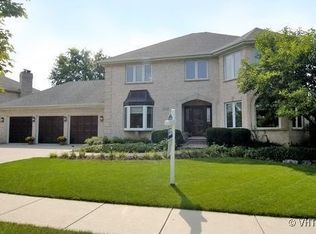
$620,500
4 bd|2 ba|3.1k sqft
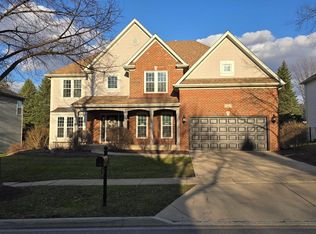
1062 Parkview Cir, Carol Stream, IL 60188
Off Market
Zillow last checked: 7 hours ago
Listing updated: 13 hours ago
Nadejda Levin 847-563-7070,
Barr Agency, Inc
$638,300
$606,000 - $670,000
$4,069/mo
| Date | Event | Price |
|---|---|---|
| 4/7/2026 | Listed for sale | $649,900+1.6%$187/sqft |
Source: | ||
| 4/16/2025 | Listing removed | $639,900$184/sqft |
Source: | ||
| 4/1/2025 | Listed for sale | $639,900-1.5%$184/sqft |
Source: | ||
| 4/1/2025 | Listing removed | $649,900$187/sqft |
Source: | ||
| 3/12/2025 | Listed for sale | $649,900$187/sqft |
Source: | ||
| 8/23/2024 | Listing removed | $649,900$187/sqft |
Source: | ||
| 8/17/2024 | Listed for sale | $649,900$187/sqft |
Source: | ||
| 8/17/2024 | Listing removed | -- |
Source: | ||
| 8/6/2024 | Listed for sale | $649,900+36.8%$187/sqft |
Source: | ||
| 10/20/2022 | Sold | $475,000+8%$137/sqft |
Source: | ||
| 8/22/2022 | Pending sale | $440,000$127/sqft |
Source: | ||
| 8/22/2022 | Contingent | $440,000$127/sqft |
Source: | ||
| 8/16/2022 | Listed for sale | $440,000+31.3%$127/sqft |
Source: | ||
| 7/17/2012 | Sold | $335,000-2.8%$96/sqft |
Source: | ||
| 3/17/2012 | Price change | $344,500-1.4%$99/sqft |
Source: RE/MAX All Pro #07967782 Report a problem | ||
| 3/10/2012 | Price change | $349,500-0.1%$100/sqft |
Source: RE/MAX All Pro #07967782 Report a problem | ||
| 3/1/2012 | Price change | $350,000-1.9%$101/sqft |
Source: RE/MAX All Pro #07967782 Report a problem | ||
| 2/16/2012 | Price change | $356,900-0.8%$103/sqft |
Source: RE/MAX All Pro #07967782 Report a problem | ||
| 1/4/2012 | Price change | $359,9000%$103/sqft |
Source: RE/MAX All Pro #07967782 Report a problem | ||
| 10/19/2011 | Price change | $360,000-1.1%$104/sqft |
Source: RE/MAX All Pro #07836734 Report a problem | ||
| 9/23/2011 | Price change | $364,000-1.4%$105/sqft |
Source: RE/MAX All Pro #07836734 Report a problem | ||
| 8/10/2011 | Price change | $369,000-1.3%$106/sqft |
Source: RE/MAX All Pro #07836734 Report a problem | ||
| 8/3/2011 | Price change | $373,900-0.3%$108/sqft |
Source: RE/MAX All Pro #07836734 Report a problem | ||
| 7/7/2011 | Price change | $374,900-1.3%$108/sqft |
Source: RE/MAX All Pro #07836734 Report a problem | ||
| 6/20/2011 | Listed for sale | $379,900+24.6%$109/sqft |
Source: RE/MAX All Pro #07836734 Report a problem | ||
| 9/20/2002 | Sold | $305,000$88/sqft |
Source: Public Record Report a problem | ||
| Year | Property taxes | Tax assessment |
|---|---|---|
| 2024 | $12,171 +6.4% | $149,910 +10.2% |
| 2023 | $11,443 +7.5% | $136,010 +7.6% |
| 2022 | $10,649 +5.1% | $126,410 +5.3% |
| 2021 | $10,127 +2.3% | $120,000 +3.1% |
| 2020 | $9,896 +4% | $116,400 +3.7% |
| 2019 | $9,518 +1.2% | $112,250 +4.5% |
| 2018 | $9,404 +1.9% | $107,410 +4.2% |
| 2017 | $9,225 +1.8% | $103,130 +4.7% |
| 2016 | $9,059 +0.7% | $98,510 +5.6% |
| 2015 | $8,996 -6.8% | $93,250 -4.9% |
| 2014 | $9,656 +0.6% | $98,080 -2.3% |
| 2013 | $9,596 +3.8% | $100,430 -5% |
| 2012 | $9,243 +2.9% | $105,710 -7.6% |
| 2011 | $8,986 +3.3% | $114,370 -3% |
| 2010 | $8,700 -8.2% | $117,910 -14% |
| 2009 | $9,481 +1.6% | $137,130 |
| 2008 | $9,327 +4.2% | $137,130 +5% |
| 2007 | $8,952 +5.1% | $130,600 +6.4% |
| 2006 | $8,516 +7.1% | $122,690 +5.2% |
| 2005 | $7,954 +6.5% | $116,630 +5.7% |
| 2004 | $7,466 +6.6% | $110,340 +8.1% |
| 2003 | $7,003 +12.5% | $102,070 +8% |
| 2002 | $6,228 +3.1% | $94,510 +7.9% |
| 2001 | $6,038 +3.6% | $87,580 +5.5% |
| 2000 | $5,827 | $83,010 |
Source: MRED as distributed by MLS GRID. This data may not be complete. We recommend contacting the local school district to confirm school assignments for this home.