$40,657
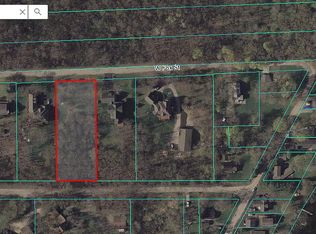
1 Acres
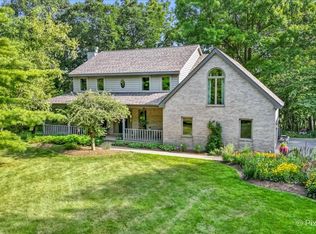
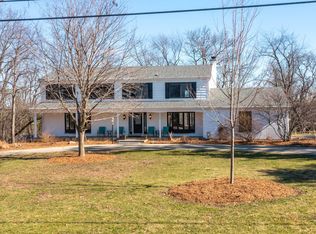
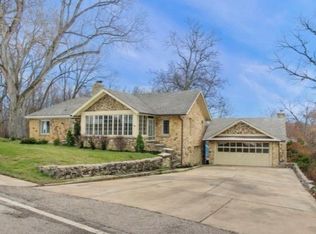
28909 W Fox St, Cary, IL 60013
Off Market
Likely to sell faster than
Zillow last checked: 7 hours ago
Listing updated: April 02, 2026 at 10:43am
Beth Repta 877-366-2213,
LPT Realty
Not available
Estimated sales range
Not available
Not available
| Date | Event | Price |
|---|---|---|
| 4/2/2026 | Listed for sale | $725,000+50.1%$159/sqft |
Source: | ||
| 6/1/2018 | Sold | $483,000-2.4%$106/sqft |
Source: | ||
| 4/7/2018 | Pending sale | $495,000$109/sqft |
Source: Coldwell Banker The Real Estate Group #09874645 Report a problem | ||
| 3/6/2018 | Listed for sale | $495,000-4.6%$109/sqft |
Source: Coldwell Banker The Real Estate Group #09874645 Report a problem | ||
| 8/23/2014 | Listing removed | $519,000$114/sqft |
Source: Coldwell Banker Honig-Bell #08671099 Report a problem | ||
| 7/27/2014 | Price change | $519,000-2.1%$114/sqft |
Source: Coldwell Banker Honig-Bell #08671099 Report a problem | ||
| 7/14/2014 | Listed for sale | $529,900+0.2%$116/sqft |
Source: Coldwell Banker Honig-Bell #08671099 Report a problem | ||
| 10/1/2013 | Listing removed | $529,000$116/sqft |
Source: Coldwell Banker Honig-Bell #08261942 Report a problem | ||
| 8/21/2013 | Price change | $529,000-2.9%$116/sqft |
Source: Coldwell Banker Honig-Bell #08261942 Report a problem | ||
| 7/9/2013 | Price change | $545,000-5.4%$119/sqft |
Source: Coldwell Banker Honig-Bell #08261942 Report a problem | ||
| 5/16/2013 | Price change | $576,000-1.4%$126/sqft |
Source: Coldwell Banker Honig-Bell #08261942 Report a problem | ||
| 4/26/2013 | Price change | $584,000-0.8%$128/sqft |
Source: Coldwell Banker Honig-Bell #08261942 Report a problem | ||
| 2/2/2013 | Listed for sale | $589,000+741.4%$129/sqft |
Source: Honig Realty, Inc. (dba. Coldwell Banker Honig-Bell) #08261942 Report a problem | ||
| 4/22/2002 | Sold | $70,000$15/sqft |
Source: Public Record Report a problem | ||
| Year | Property taxes | Tax assessment |
|---|---|---|
| 2023 | $13,680 +17% | $195,415 +5.5% |
| 2022 | $11,696 +1.2% | $185,228 +19.7% |
| 2021 | $11,553 -0.5% | $154,723 +2% |
| 2020 | $11,605 -5.6% | $151,622 +2.7% |
| 2019 | $12,288 +15.3% | $147,622 +17.1% |
| 2018 | $10,657 | $126,116 +2% |
| 2017 | $10,657 -0.5% | $123,583 +3.9% |
| 2016 | $10,714 -13.3% | $118,921 +6.6% |
| 2015 | $12,360 +3.5% | $111,538 -10.5% |
| 2014 | $11,939 +8% | $124,636 -1.7% |
| 2012 | $11,056 -7.4% | $126,779 -19% |
| 2011 | $11,941 +13.9% | $156,500 -0.3% |
| 2010 | $10,480 +2.3% | $156,999 -6.4% |
| 2009 | $10,246 +1% | $167,734 |
| 2008 | $10,146 +17.4% | $167,734 +4.9% |
| 2006 | $8,640 +17.6% | $159,853 |
| 2005 | $7,346 -14.4% | -- |
| 2004 | $8,585 +12.7% | -- |
| 2003 | $7,618 | -- |
Source: MRED as distributed by MLS GRID. This data may not be complete. We recommend contacting the local school district to confirm school assignments for this home.