$432,700
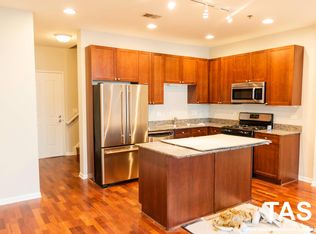
2 bd|2 ba|-- sqft
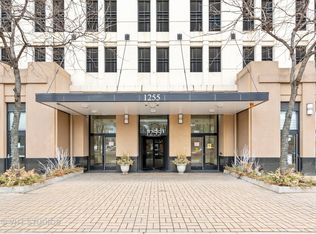
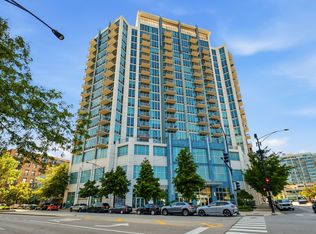
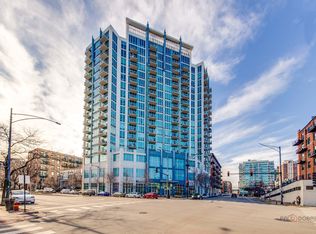
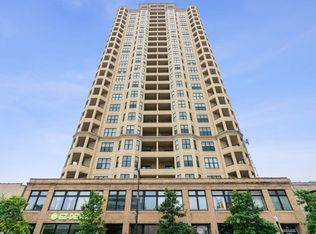
1464 S Michigan Ave APT 1101, Chicago, IL 60605
Off Market
Zillow last checked:
Listing updated:
Abhijit Leekha 630-283-2111,
Property Economics Inc.
$300,700
$286,000 - $316,000
$2,870/mo
| Date | Event | Price |
|---|---|---|
| 4/22/2026 | Listed for sale | $299,000+6.8%$289/sqft |
Source: | ||
| 9/18/2024 | Listing removed | $2,300$2/sqft |
Source: MRED as distributed by MLS GRID #12152197 Report a problem | ||
| 8/30/2024 | Listed for rent | $2,300+24.3%$2/sqft |
Source: MRED as distributed by MLS GRID #12152197 Report a problem | ||
| 8/23/2024 | Listing removed | $279,900$270/sqft |
Source: | ||
| 8/14/2024 | Listed for sale | $279,900-6.7%$270/sqft |
Source: | ||
| 7/24/2023 | Listing removed | -- |
Source: | ||
| 6/20/2023 | Listed for sale | $299,900-1.5%$289/sqft |
Source: | ||
| 6/20/2023 | Listing removed | -- |
Source: | ||
| 6/3/2023 | Price change | $304,400-0.2%$294/sqft |
Source: | ||
| 5/11/2023 | Listed for sale | $304,900$294/sqft |
Source: | ||
| 5/11/2023 | Listing removed | -- |
Source: | ||
| 4/26/2023 | Contingent | $304,900$294/sqft |
Source: | ||
| 4/19/2023 | Listed for sale | $304,900+8.9%$294/sqft |
Source: | ||
| 4/19/2023 | Listing removed | -- |
Source: | ||
| 3/30/2023 | Price change | $279,900-3.4%$270/sqft |
Source: | ||
| 3/6/2023 | Price change | $289,900-5%$280/sqft |
Source: | ||
| 2/14/2023 | Listed for sale | $304,999-6.2%$294/sqft |
Source: | ||
| 11/11/2020 | Listing removed | $1,850$2/sqft |
Source: Open Path Realty #10904035 Report a problem | ||
| 10/13/2020 | Price change | $1,850-11.9%$2/sqft |
Source: Open Path Realty #10904035 Report a problem | ||
| 8/26/2020 | Listing removed | $325,000$314/sqft |
Source: Open Path Realty #10738742 Report a problem | ||
| 8/22/2020 | Listed for sale | $325,000$314/sqft |
Source: Open Path Realty #10738742 Report a problem | ||
| 7/20/2020 | Price change | $2,100-4.5%$2/sqft |
Source: Open Path Realty #10722543 Report a problem | ||
| 7/20/2020 | Listing removed | $325,000$314/sqft |
Source: Open Path Realty #10738742 Report a problem | ||
| 5/23/2020 | Listed for rent | $2,200$2/sqft |
Source: Open Path Realty #10722543 Report a problem | ||
| 4/4/2020 | Listed for sale | $325,000+35.4%$314/sqft |
Source: Open Path Realty #10683838 Report a problem | ||
| 3/5/2012 | Sold | $240,000$232/sqft |
Source: | ||
| Year | Property taxes | Tax assessment |
|---|---|---|
| 2024 | -- | $27,793 -5.5% |
| 2023 | $6,228 +2.6% | $29,420 |
| 2022 | $6,070 +2.3% | $29,420 |
| 2021 | $5,934 -2.6% | $29,420 +7.5% |
| 2020 | $6,095 +1.8% | $27,359 -8.2% |
| 2019 | $5,988 +1.7% | $29,806 |
| 2018 | $5,888 +17.9% | $29,806 +28.4% |
| 2017 | $4,996 +7.5% | $23,206 |
| 2016 | $4,648 +5% | $23,206 -3.9% |
| 2015 | $4,427 +1.1% | $24,157 +2.4% |
| 2014 | $4,377 +2% | $23,589 |
| 2013 | $4,290 +1.4% | $23,589 |
| 2012 | $4,233 +12.7% | $23,589 +1.8% |
| 2011 | $3,755 -0.4% | $23,175 |
| 2010 | $3,771 -2% | $23,175 -6.1% |
| 2009 | $3,847 | $24,670 |
Source: MRED as distributed by MLS GRID. This data may not be complete. We recommend contacting the local school district to confirm school assignments for this home.
A local agent can set up tours, give advice and negotiate with sellers.