$--
2 bd|2 ba|1.3k sqft
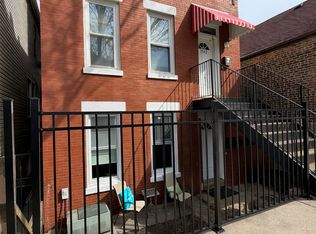
944 W 18th St APT 2, Chicago, IL 60608
Off Market
Zillow last checked: 7 hours ago
Listing updated: April 09, 2026 at 10:05am
Phillip Buoscio 312-953-6725,
Keller Williams ONEChicago
Not available
Estimated sales range
Not available
$2,101/mo
| Date | Event | Price |
|---|---|---|
| 4/9/2026 | Listed for sale | $699,900-6.6% |
Source: | ||
| 8/14/2025 | Listing removed | $1,550 |
Source: Zillow Rentals Report a problem | ||
| 8/5/2025 | Listed for rent | $1,550 |
Source: Zillow Rentals Report a problem | ||
| 7/3/2025 | Listing removed | $749,000 |
Source: | ||
| 5/15/2025 | Price change | $749,000-0.1% |
Source: | ||
| 5/7/2025 | Price change | $749,500-0.1% |
Source: | ||
| 4/22/2025 | Listed for sale | $749,900-6.1% |
Source: | ||
| 4/9/2025 | Listing removed | $799,000 |
Source: | ||
| 3/16/2025 | Listed for sale | $799,000+139.2% |
Source: | ||
| 7/29/2014 | Sold | $334,000-14.3% |
Source: | ||
| 6/7/2014 | Pending sale | $389,900 |
Source: Krain #08632646 Report a problem | ||
| 6/3/2014 | Listed for sale | $389,900+48.5% |
Source: Krain #08632646 Report a problem | ||
| 5/6/2014 | Sold | $262,500-12.2% |
Source: | ||
| 4/16/2014 | Pending sale | $299,000 |
Source: Krain #08536331 Report a problem | ||
| 4/16/2014 | Price change | $299,000+84.6% |
Source: Krain #08536331 Report a problem | ||
| 3/26/2014 | Listed for sale | $162,000 |
Source: HomeSearch.com Realty Services Inc #8536331 Report a problem | ||
| 3/25/2014 | Pending sale | $162,000 |
Source: HomeSearch.com Realty Services Inc #8536331 Report a problem | ||
| 3/25/2014 | Listed for sale | $162,000-64.4% |
Source: HomeSearch.com Realty Services Inc #8536331 Report a problem | ||
| 4/19/2007 | Sold | $455,000 |
Source: Public Record Report a problem | ||
| Year | Property taxes | Tax assessment |
|---|---|---|
| 2023 | $13,338 +2.6% | $63,214 |
| 2022 | $13,002 -22.5% | $63,214 -24.2% |
| 2021 | $16,773 +146.5% | $83,408 +173% |
| 2020 | $6,806 -3.5% | $30,550 -13% |
| 2019 | $7,055 +1.7% | $35,117 |
| 2018 | $6,937 +8.7% | $35,117 +18.4% |
| 2017 | $6,383 +7.5% | $29,649 |
| 2016 | $5,938 +9.3% | $29,649 |
| 2015 | $5,433 +7.9% | $29,649 -0.2% |
| 2014 | $5,035 -18.2% | $29,706 -18.6% |
| 2013 | $6,156 +1% | $36,475 |
| 2012 | $6,098 +8.5% | $36,475 -0.6% |
| 2011 | $5,621 +18.8% | $36,707 +5.4% |
| 2008 | $4,731 +64.3% | $34,828 |
| 2006 | $2,879 +40% | $34,828 +75% |
| 2005 | $2,056 +4.7% | $19,903 |
| 2004 | $1,963 +3.7% | $19,903 +61% |
| 2002 | $1,894 +84.1% | $12,363 |
| 2001 | $1,029 +35.4% | $12,363 |
| 2000 | $760 +1% | $12,363 +107.6% |
| 1999 | $752 | $5,955 |
Source: MRED as distributed by MLS GRID. This data may not be complete. We recommend contacting the local school district to confirm school assignments for this home.