$267,400
3 bd|1 ba|987 sqft
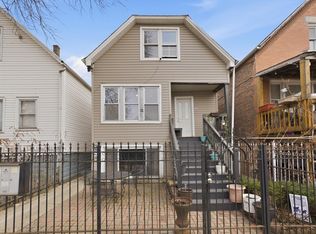
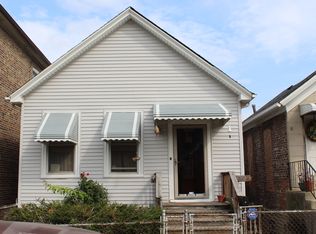
3529 S Paulina St, Chicago, IL 60609
Off Market
Zillow last checked: 8 hours ago
Listing updated: February 27, 2026 at 12:06pm
Ben Lalez 773-466-7150,
Compass,
John Kralovec 708-305-2443,
Compass
$368,700
$321,000 - $420,000
$1,988/mo
| Date | Event | Price |
|---|---|---|
| 2/27/2026 | Listed for sale | $229,000+14.5%$73/sqft |
Source: | ||
| 3/29/2024 | Sold | $200,000-7%$63/sqft |
Source: | ||
| 2/29/2024 | Contingent | $214,999$68/sqft |
Source: | ||
| 2/27/2024 | Listed for sale | $214,999$68/sqft |
Source: | ||
| 2/20/2024 | Contingent | $214,999$68/sqft |
Source: | ||
| 2/1/2024 | Price change | $214,999-2.3%$68/sqft |
Source: | ||
| 1/16/2024 | Listed for sale | $219,999$70/sqft |
Source: | ||
| 1/8/2024 | Contingent | $219,999$70/sqft |
Source: | ||
| 1/4/2024 | Listed for sale | $219,999-6.4%$70/sqft |
Source: | ||
| 1/4/2024 | Listing removed | -- |
Source: | ||
| 12/4/2023 | Listed for sale | $234,999$75/sqft |
Source: | ||
| 12/4/2023 | Listing removed | -- |
Source: | ||
| 12/2/2023 | Listed for sale | $234,999$75/sqft |
Source: | ||
| 11/22/2023 | Contingent | $234,999$75/sqft |
Source: | ||
| 11/10/2023 | Price change | $234,999-2.1%$75/sqft |
Source: | ||
| 10/24/2023 | Listed for sale | $239,999-2%$76/sqft |
Source: | ||
| 10/24/2023 | Listing removed | -- |
Source: | ||
| 10/9/2023 | Price change | $244,999-2%$78/sqft |
Source: | ||
| 9/21/2023 | Listed for sale | $249,999-3.8%$79/sqft |
Source: | ||
| 5/4/2010 | Listing removed | $260,000$83/sqft |
Source: Coldwell Banker** #06929000 Report a problem | ||
| 7/25/2008 | Listed for sale | $260,000$83/sqft |
Source: Coldwell Banker** #06929000 Report a problem | ||
| Year | Property taxes | Tax assessment |
|---|---|---|
| 2023 | $3,587 +2.6% | $17,000 |
| 2022 | $3,497 +2.3% | $17,000 |
| 2021 | $3,419 -4.1% | $17,000 +6.2% |
| 2020 | $3,567 -1.3% | $16,010 -11% |
| 2019 | $3,614 +1.7% | $17,989 |
| 2018 | $3,553 -0.7% | $17,989 +8.3% |
| 2017 | $3,577 +7.5% | $16,617 |
| 2016 | $3,328 +9.3% | $16,617 |
| 2015 | $3,045 -2.7% | $16,617 -1.5% |
| 2014 | $3,130 +2% | $16,869 |
| 2013 | $3,068 +1.4% | $16,869 |
| 2012 | $3,027 +4.5% | $16,869 -5.6% |
| 2011 | $2,896 +36.7% | $17,870 |
| 2010 | $2,119 +13.8% | $17,870 |
| 2009 | $1,861 -6.5% | $17,870 -13.2% |
| 2008 | $1,990 +22.4% | $20,585 |
| 2007 | $1,625 +19.1% | $20,585 |
| 2006 | $1,364 -5.1% | $20,585 +72.2% |
| 2005 | $1,438 +1.9% | $11,956 |
| 2004 | $1,412 +4.5% | $11,956 |
| 2003 | $1,351 -5.4% | $11,956 +22.3% |
| 2002 | $1,429 +6.4% | $9,775 |
| 2001 | $1,342 +28.7% | $9,775 |
| 2000 | $1,043 +0.5% | $9,775 +31.6% |
| 1999 | $1,038 | $7,430 |
Source: MRED as distributed by MLS GRID. This data may not be complete. We recommend contacting the local school district to confirm school assignments for this home.