$855,500
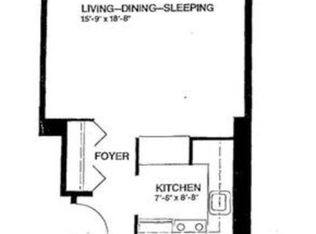
-- bd|1 ba|650 sqft
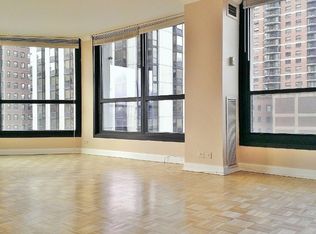
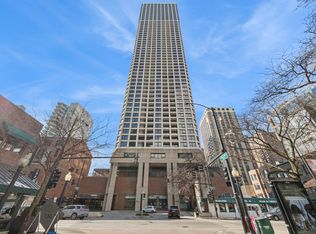
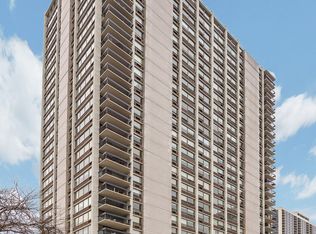
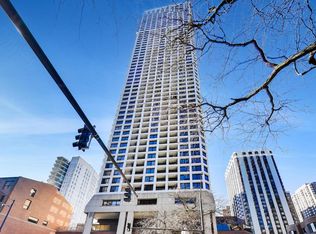
1030 N State St APT 7, Chicago, IL 60610
Off Market
Zillow last checked: 8 hours ago
Listing updated: February 27, 2026 at 06:33am
An-An Ku 312-878-6464,
Urban Living Properties, LLC,
Emily Stoner,
Urban Living Properties, LLC
$363,500
$345,000 - $382,000
$2,383/mo
| Date | Event | Price |
|---|---|---|
| 1/6/2026 | Listed for sale | $375,000+56.3%$441/sqft |
Source: | ||
| 2/17/2018 | Listing removed | $1,900$2/sqft |
Source: Berkshire Hathaway HomeServices KoenigRubloff Realty Group #09747379 Report a problem | ||
| 10/26/2017 | Price change | $1,900-2.6%$2/sqft |
Source: Berkshire Hathaway HomeServices KoenigRubloff Realty Group #09747379 Report a problem | ||
| 10/17/2017 | Price change | $1,950-1.3%$2/sqft |
Source: Berkshire Hathaway HomeServices KoenigRubloff Realty Group #09747379 Report a problem | ||
| 9/29/2017 | Price change | $1,975-1.3%$2/sqft |
Source: Berkshire Hathaway HomeServices KoenigRubloff Realty Group #09747379 Report a problem | ||
| 9/11/2017 | Listed for rent | $2,000$2/sqft |
Source: Berkshire Hathaway HomeServices KoenigRubloff #09747379 Report a problem | ||
| 8/13/2001 | Sold | $240,000+142.4%$282/sqft |
Source: Public Record Report a problem | ||
| 5/11/1995 | Sold | $99,000$116/sqft |
Source: Public Record Report a problem | ||
| Year | Property taxes | Tax assessment |
|---|---|---|
| 2023 | $7,787 +2.6% | $36,907 |
| 2022 | $7,591 +2.3% | $36,907 |
| 2021 | $7,422 +13.4% | $36,907 +25.7% |
| 2020 | $6,542 +2.2% | $29,368 -7.8% |
| 2019 | $6,403 +1.7% | $31,868 |
| 2018 | $6,295 +5.3% | $31,868 +14.8% |
| 2017 | $5,975 +7.5% | $27,758 |
| 2016 | $5,560 +9.3% | $27,758 |
| 2015 | $5,087 +8.8% | $27,758 +10.1% |
| 2014 | $4,676 +2% | $25,203 |
| 2013 | $4,584 +1.4% | $25,203 |
| 2012 | $4,523 +10% | $25,203 -0.7% |
| 2011 | $4,113 -0.4% | $25,381 |
| 2010 | $4,130 +1.7% | $25,381 -2.6% |
| 2009 | $4,062 +7.3% | $26,052 -1.3% |
| 2008 | $3,787 +1% | $26,398 |
| 2007 | $3,749 -1.1% | $26,398 |
| 2006 | $3,790 -3.4% | $26,398 +10% |
| 2005 | $3,921 +1% | $23,997 |
| 2004 | $3,882 +2.2% | $23,997 |
| 2003 | $3,797 +24.4% | $23,997 +41.2% |
| 2002 | $3,054 +3.7% | $16,996 |
| 2001 | $2,943 +61% | $16,996 |
| 2000 | $1,828 +0% | $16,996 +47.6% |
| 1999 | $1,828 | $11,517 |
Source: MRED as distributed by MLS GRID. This data may not be complete. We recommend contacting the local school district to confirm school assignments for this home.