$304,300
1 bd|1 ba|-- sqft
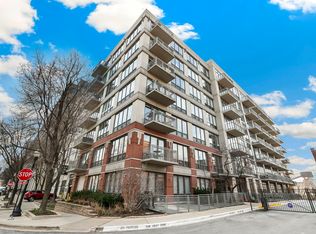
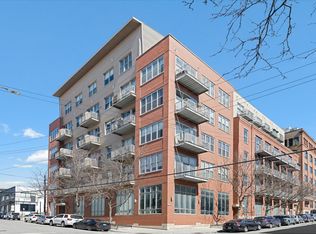
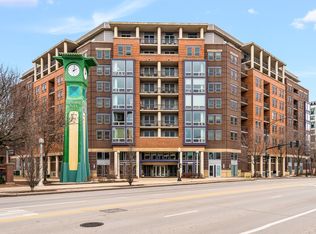
900 N Kingsbury St APT 720, Chicago, IL 60610
Off Market
Zillow last checked: 7 hours ago
Listing updated: April 06, 2026 at 09:56am
Nancy Hearon 312-642-1400,
Berkshire Hathaway HomeServices Chicago
Not available
Estimated sales range
Not available
Not available
| Date | Event | Price |
|---|---|---|
| 4/6/2026 | Listed for sale | $350,000+9.4%$425/sqft |
Source: | ||
| 4/27/2025 | Listing removed | $319,900$388/sqft |
Source: | ||
| 4/15/2025 | Listing removed | $2,490$3/sqft |
Source: MRED as distributed by MLS GRID #12331979 Report a problem | ||
| 4/9/2025 | Price change | $319,900-3%$388/sqft |
Source: | ||
| 4/9/2025 | Listed for rent | $2,490+10.7%$3/sqft |
Source: MRED as distributed by MLS GRID #12331979 Report a problem | ||
| 2/12/2025 | Listed for sale | $329,900-1.5%$400/sqft |
Source: | ||
| 2/12/2025 | Listing removed | $335,000$407/sqft |
Source: | ||
| 9/17/2024 | Price change | $335,000-4.3%$407/sqft |
Source: | ||
| 8/15/2024 | Listed for sale | $350,000+1490.9%$425/sqft |
Source: | ||
| 8/15/2021 | Listing removed | -- |
Source: Zillow Rental Manager Report a problem | ||
| 7/15/2021 | Listed for rent | $2,250+2.3%$3/sqft |
Source: Zillow Rental Manager Report a problem | ||
| 3/24/2021 | Listing removed | -- |
Source: Owner Report a problem | ||
| 7/28/2019 | Listing removed | $2,200$3/sqft |
Source: Owner Report a problem | ||
| 7/16/2019 | Price change | $2,200-6.4%$3/sqft |
Source: Owner Report a problem | ||
| 6/23/2019 | Listed for rent | $2,350+6.8%$3/sqft |
Source: Owner Report a problem | ||
| 7/14/2018 | Listing removed | $2,200$3/sqft |
Source: Owner Report a problem | ||
| 5/21/2018 | Listed for rent | $2,200$3/sqft |
Source: Owner Report a problem | ||
| 4/14/2014 | Listing removed | $2,200$3/sqft |
Source: Postlets Report a problem | ||
| 2/13/2014 | Listed for rent | $2,200$3/sqft |
Source: Postlets Report a problem | ||
| 1/3/2005 | Sold | $22,000$27/sqft |
Source: Public Record Report a problem | ||
| Year | Property taxes | Tax assessment |
|---|---|---|
| 2023 | $4,722 +3.1% | $25,695 |
| 2022 | $4,581 +1.9% | $25,695 |
| 2021 | $4,497 +5.1% | $25,695 +15.2% |
| 2020 | $4,279 +1.9% | $22,309 -8.3% |
| 2019 | $4,198 +1.7% | $24,326 |
| 2018 | $4,127 +10.5% | $24,326 +17.4% |
| 2017 | $3,735 +2.3% | $20,724 |
| 2016 | $3,651 +10.1% | $20,724 |
| 2015 | $3,317 +17.5% | $20,724 +16.5% |
| 2014 | $2,823 +2.4% | $17,784 |
| 2013 | $2,756 +0.5% | $17,784 |
| 2012 | $2,744 -2.3% | $17,784 -8.1% |
| 2011 | $2,809 -5.6% | $19,353 -3.7% |
| 2010 | $2,976 -6.2% | $20,106 -9.1% |
| 2009 | $3,171 +44.9% | $22,116 +3.9% |
| 2008 | $2,189 +3.2% | $21,288 -3.3% |
| 2007 | $2,121 -32.9% | $22,016 |
| 2006 | $3,161 +25.6% | $22,016 +42.9% |
| 2005 | $2,517 +1% | $15,403 |
| 2004 | $2,492 | $15,403 |
Source: MRED as distributed by MLS GRID. This data may not be complete. We recommend contacting the local school district to confirm school assignments for this home.