$170,400
-- bd|1 ba|-- sqft
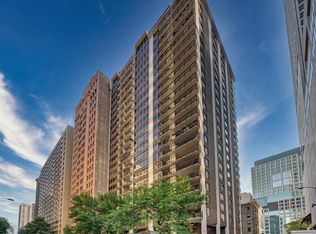
260 E Chestnut St APT 301, Chicago, IL 60611
Off Market

Zillow last checked: 8 hours ago
Listing updated: 12 hours ago
Sohail Salahuddin (312)437-7799,
eXp Realty
$563,200
$535,000 - $591,000
$5,479/mo
| Date | Event | Price |
|---|---|---|
| 2/24/2026 | Listed for sale | $575,000+19.8%$319/sqft |
Source: | ||
| 4/1/2021 | Listing removed | -- |
Source: | ||
| 8/11/2020 | Price change | $479,900-4%$267/sqft |
Source: @properties #10813723 Report a problem | ||
| 1/3/2020 | Price change | $499,900-2.5%$278/sqft |
Source: @properties #10813723 Report a problem | ||
| 11/20/2019 | Price change | $512,900-2.3%$285/sqft |
Source: @properties #10578053 Report a problem | ||
| 10/16/2019 | Price change | $524,900-3.7%$292/sqft |
Source: @properties #10549423 Report a problem | ||
| 8/4/2019 | Price change | $545,000-0.9%$303/sqft |
Source: @properties #10513048 Report a problem | ||
| 6/1/2019 | Listed for sale | $549,900+17.2%$306/sqft |
Source: @properties #10400441 Report a problem | ||
| 8/19/2015 | Sold | $469,000-6%$261/sqft |
Source: | ||
| 7/29/2015 | Pending sale | $499,000$277/sqft |
Source: Berkshire Hathaway HomeServices KoenigRubloff Realty Group #08965636 Report a problem | ||
| 6/26/2015 | Listed for sale | $499,000-15.4%$277/sqft |
Source: Berkshire Hathaway HomeServices KoenigRubloff #08965636 Report a problem | ||
| 4/7/2013 | Listing removed | $589,900$328/sqft |
Source: Prudential Rubloff #08067491 Report a problem | ||
| 8/17/2012 | Price change | $589,900-1.6%$328/sqft |
Source: Prudential Rubloff #08067491 Report a problem | ||
| 5/16/2012 | Listed for sale | $599,500+14.8%$333/sqft |
Source: Prudential Rubloff #08067491 Report a problem | ||
| 6/13/2006 | Sold | $522,000+541.8%$290/sqft |
Source: Public Record Report a problem | ||
| 10/8/1993 | Sold | $81,333$45/sqft |
Source: Public Record Report a problem | ||
| Year | Property taxes | Tax assessment |
|---|---|---|
| 2023 | $10,549 +2.6% | $49,999 |
| 2022 | $10,284 +2.3% | $49,999 |
| 2021 | $10,054 +15.8% | $49,999 +12.2% |
| 2020 | $8,684 +2.5% | $44,564 -7.8% |
| 2019 | $8,476 +1.7% | $48,359 |
| 2018 | $8,331 0% | $48,359 +8% |
| 2017 | $8,333 +2.7% | $44,787 |
| 2016 | $8,113 -1.1% | $44,787 |
| 2015 | $8,207 +4.5% | $44,787 +5.8% |
| 2014 | $7,853 +2% | $42,327 |
| 2013 | $7,698 +1.4% | $42,327 |
| 2012 | $7,595 +10.6% | $42,327 -0.2% |
| 2011 | $6,870 -7.1% | $42,394 -6.7% |
| 2010 | $7,393 -0.9% | $45,436 -5% |
| 2009 | $7,458 +26.9% | $47,828 +16.7% |
| 2008 | $5,879 +1% | $40,984 |
| 2007 | $5,821 -1.1% | $40,984 |
| 2006 | $5,884 -8.4% | $40,984 -0.4% |
| 2005 | $6,423 +19% | $41,138 |
| 2004 | $5,398 +3.4% | $41,138 |
| 2003 | $5,223 +8.5% | $41,138 +43.8% |
| 2002 | $4,814 +4.5% | $28,615 |
| 2001 | $4,605 +23.3% | $28,615 |
| 2000 | $3,735 -0.3% | $28,615 +33.4% |
| 1999 | $3,748 | $21,444 |
Source: MRED as distributed by MLS GRID. This data may not be complete. We recommend contacting the local school district to confirm school assignments for this home.